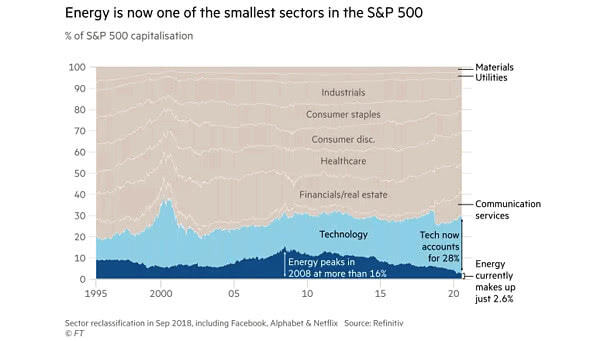
% of S&P 500 Capitalization

% of S&P 500 Capitalization Currently, the energy sector accounts for only 2.6% of the S&P 500’s capitalization, while tech now accounts for 28%. Image: Financial Times

Breakeven Prices for Existing U.S. Oil Wells

Breakeven Prices for Existing U.S. Oil Wells Breakeven prices for existing U.S. oil wells highlights that the current WTI oil price is too low for oil companies to make a decent return. Image: Federal Reserve Bank of Dallas Energy Survey

U.S. Core PCE vs. Fed Target

U.S. Core PCE vs. Fed Target The U.S. core personal consumption expenditures price index, which excludes food and energy, rises to 1.6% in June. Inflation trending back up toward the Fed’s 2% target is good news. You may also like “U.S. Core Inflation Expected Over the Next 21 Months.”

S&P 500 Low Volatility Stocks Are the Best Performing Asset YTD

S&P 500 Low Volatility Stocks Are the Best Performing Asset YTD This chart shows that S&P 500 low volatility stocks are the best performing asset year-to-date (outside of GSCI energy). Actually, high-quality stocks are a good way to protect against a weak economy. Image: Goldman Sachs Global Investment Research
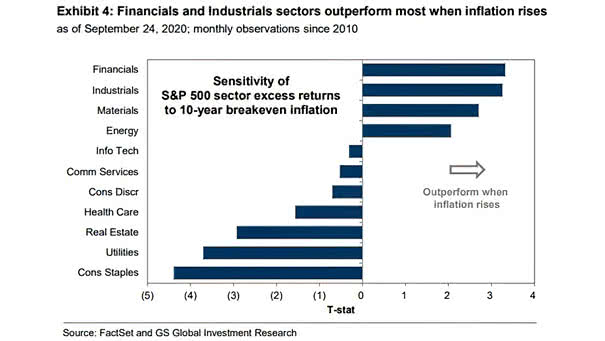
Why Are Oil and Gas Companies Making Massive Investments for the Next 10 Years?

Why Are Oil and Gas Companies Making Massive Investments for the Next 10 Years? Oil and gas companies are making massive investments for good reasons. The energy demand will flatten after 2030 and the oil and gas industry will go through a transition over the next decades. Below is the oil and gas forecast to 2050.…

Why Is Core Inflation So Low Compared to Previous Business Cycles?

Why Is Core Inflation So Low Compared To Previous Business Cycles? The Consumer Price Index Less Food & Energy (Core CPI) is very low compared to previous business cycles in the US, for several reasons: – not fast-rising money supply – globalization: inflation is a global phenomenon – lack of wage acceleration – increase in…