Market Returns and Long Term Assumptions
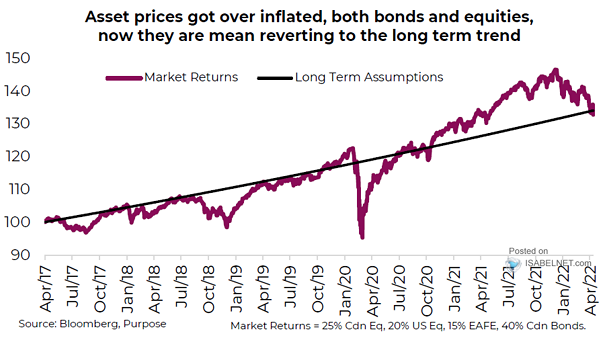
Market Returns and Long Term Assumptions Is the recent market’s sell-off a buying opportunity? Image: Richardson Wealth
Market Returns and Long Term Assumptions Is the recent market’s sell-off a buying opportunity? Image: Richardson Wealth
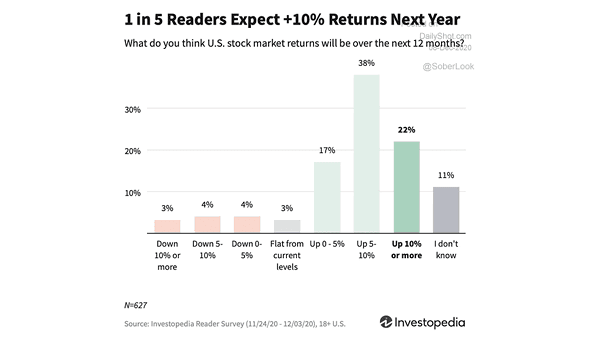
Survey – U.S. Stock Market Returns in 2021 Most investors are optimistic and expect the U.S. stock market to move much higher over the next 12 months. Image: Investopedia

Fund Managers Sentiment and Global Stock Market Returns (MSCI ACWI) Are fund managers too bearish? Two-thirds of global fund managers say this is a bear market rally. Image: Hondo Tomasz
Morgan Stanley Forecasts a Subdued Decade for Market Returns Morgan Stanley forecasts anemic returns over the next 10 years, due to low yields, low growth and low inflation expectations. Image: Financial Times
Distribution of U.S. Market Returns Since 1926, annual returns between 20% and 30% are the most common. Year-to-date, the S&P 500 Index has gained 23%. Image: Center of Research in Security Prices
Initial Fed Rate Cuts and Resulting Forward Market Returns This spreadsheet also shows that the S&P 500 has performed well on average, around first Fed rate cut. Image: Fundstrat Global Advisors, LLC
Indexed S&P 500 Return – Market Hours vs. Overnight Following the April market turmoil, most of the rally has happened during regular U.S. trading hours, with overnight returns remaining relatively muted. Image: Deutsche Bank Asset Allocation
S&P 500 Average Returns in Bull Markets While the third year of a bull market often shows signs of relative weakness, patient investors may find substantial opportunities in the following years, as historical trends suggest the potential for sustained growth. Image: Carson Investment Research
Return – Dow Jones U.S. Thematic Market Neutral Momentum Index With a remarkable 31% return in 2024, momentum investing has emerged as a standout equity strategy, poised for its best year since 2002. Image: Bloomberg
S&P 500 Return – Year 3 of Bull Market Like a kid who loses interest in his favorite toy after two years, the S&P 500 tends to slow down in the third year of a bull market. Its gains often become less impressive compared to the first two years. Image: MarketDesk
S&P 500 Market Concentration vs. 10-Year Annualized Forward Returns High concentration in the S&P 500 may boost short-term performance, but it often signals lower future returns, particularly during non-recessionary periods. Image: Goldman Sachs Global Investment Research