WTI Oil Prices in Real Terms

WTI Oil Prices in Real Terms The 2026 oil shock looks far less dramatic in historical terms. It still bites, just not with the same force. Once you adjust for inflation and reduced energy intensity, today’s price levels compare more favourably than in 2022. Image: Deutsche Bank

Oil Prices vs. U.S. Inflation

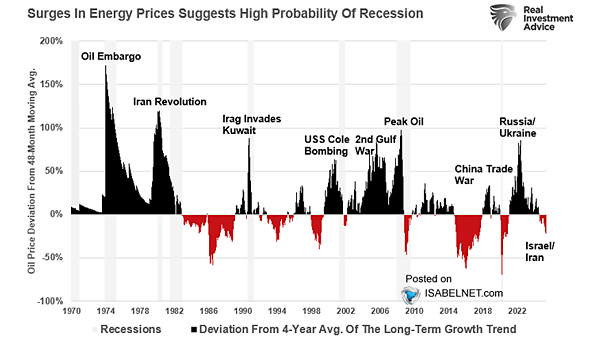
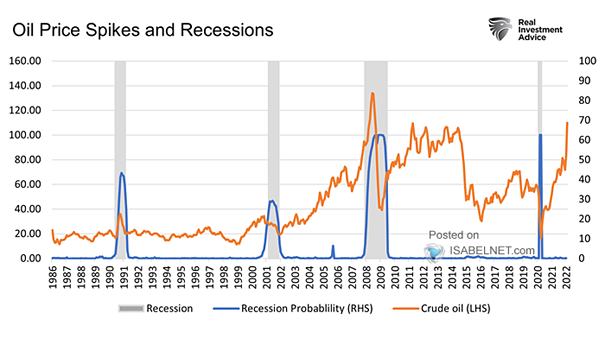
Oil Prices vs. U.S. Inflation When oil climbs, inflation usually follows, lifting energy and transport costs that spread through the economy. The result often weighs on stocks, as tighter profit margins and softer consumer spending feed through the market. Image: Real Investment Advice

Difference between Front-End Brent Crude Oil Futures and 6-Month Brent Futures

Difference between Front-End Brent Crude Oil Futures and 6-Month Brent Futures Markets are betting the Middle East conflict will be short‑lived. Oil futures signal tight near‑term supply but confidence that disruptions will fade quickly. But markets tend to price in calm faster than reality delivers. Image: Deutsche Bank

Brent Crude Oil Futures

Brent Crude Oil Futures Markets are betting the Middle East conflict won’t drag on, a view reflected in oil futures prices. The curve remains in backwardation, indicating tight near‑term supply but confidence that any disruption will prove short‑lived. Image: Alpine Macro

Average S&P 500 Performance After Oil Shocks

Average S&P 500 Performance After Oil Shocks On average, U.S. equities have tended to be under pressure in the months following major oil shocks, though the pattern is not uniform and depends heavily on whether the shock is large, persistent, and tied to broader macro stress. Image: Deutsche Bank

Average U.S. 10-Year Treasury Yield Performance After Oil Shocks

Average U.S. 10-Year Treasury Yield Performance After Oil Shocks Historically, sharp oil‑price spikes have often, but not always, been followed by weaker bond performance because higher energy costs push headline inflation and expectations of future inflation higher. Image: Deutsche Bank

Energy Positioning vs. Oil Price

Energy Positioning vs. Oil Price Energy positioning is lagging what you’d expect considering how far oil prices have already moved up. Image: Deutsche Bank Asset Allocation

Brent Oil Price Forecast

Brent Oil Price Forecast Goldman Sachs has lifted its 2026 oil price forecast, now seeing Brent crude averaging $85 a barrel and WTI at $79, as disruptions in the Strait of Hormuz keep energy markets on edge. Image: Goldman Sachs Global Investment Research

Monthly Brent Oil Price

Monthly Brent Oil Price Oil prices face greater upside than downside risk in the near term, with Brent likely to stay elevated if disruptions persist. Given how slowly such issues tend to ease, the balance of risk points higher for now. Image: Goldman Sachs Global Investment Research

S&P 500 Futures vs. Brent Crude Oil

S&P 500 Futures vs. Brent Crude Oil S&P 500 futures and Brent crude oil have moved in tandem lately, but the correlation has softened this week. Are markets breaking away from oil prices? Maybe investors are focusing more on rates and earnings than commodities now. Image: Deutsche Bank

S&P 500 and Crude Oil

S&P 500 and Crude Oil Since the conflict erupted in the Middle East, the S&P 500 has been moving almost opposite to oil, showing a striking 91% inverse correlation. When crude rises, investors often worry about squeezed U.S. consumers and slower growth. Image: Deutsche Bank Asset Allocation