MSCI World Value vs. Growth Around Bear Markets
MSCI World Value vs. Growth Around Bear Markets The underperformance of value vs. growth during the bear market and the recovery has been unprecedented. Image: Goldman Sachs Global Investment Research
MSCI World Value vs. Growth YTD Will global value stocks continue to underperform global growth stocks, as the global economy rebounds? Image: J.P. Morgan
Performance – MSCI Europe vs. MSCI ACWI and MSCI World Value vs. Growth Chart suggesting that Europe’s relative performance vs. MSCI ACWI seems similar to that of Value vs. Growth. Image: Morgan Stanley Research
MSCI World Growth Index vs. MSCI World Value Index Will global value stocks outperform global growth stocks in the recovery phase? Image: The Daily Shot – The Wall Street Journal
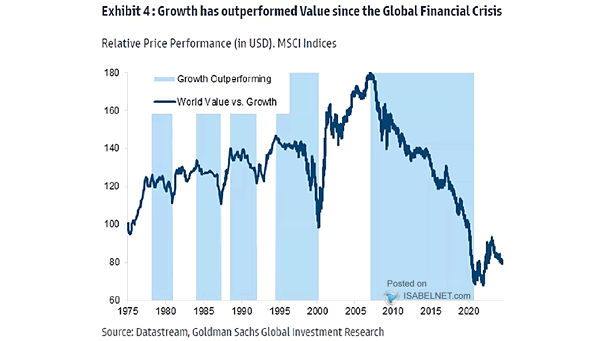
MSCI World Value vs. Growth Chart showing the record outperformance of Growth vs. Value since the Great Financial Crisis. Image: Goldman Sachs Global Investment Research
MSCI World Growth Index vs. MSCI World Value Index Over the past decade, global value stocks have remained in the shadow, while the sun has shone on global growth stocks. Image: Financial Times
MSCI All Country World Index (MSCI ACWI) – Value Minus Growth, One-Day Change Should investors forget growth stocks, as value investing is back in play? Image: Morgan Stanley Wealth Management
Energy Stocks – MSCI World Energy Index and Book Value Are energy stocks a buying opportunity? Image: Gavekal, Macrobond
MSCI Latin America vs. MSCI World and Russell 1000 Value vs. Russell 1000 Growth Latin America vs. Developed Markets has been highly correlated to Value vs. Growth. Image: Goldman Sachs Global Investment Research
Price Return Indexes – MSCI World ex-US and US Valueline Composite Index Where is the bull market exactly? Today, the Valueline composite index, considered as a proxy for the U.S. market’s performance, stands at the same level as in 1998. Image: Gavekal, Macrobond