Secular Bull Market – S&P 500 Weekly Chart with the 40-Week MA and 200-Week MA

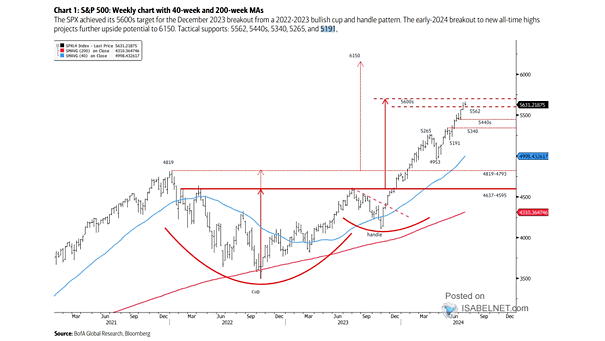
Secular Bull Market – S&P 500 Weekly Chart with the 40-Week MA and 200-Week MA The S&P 500 has reached the 5600s target based on the bullish cup and handle pattern that formed in 2022-2023. The early-2024 breakout to new all-time highs projects further upside potential to the 6150 level. Image: BofA Global Research

Secular Bull Market Analogs and S&P 500

Secular Bull Market Analogs and S&P 500 Since the Great Recession, U.S. stocks have behaved like a secular bull market, which is characterized by an extended period of growth and rising prices. Image: BofA Global Research

S&P 500 – Secular Bull and Bear Markets

S&P 500 – Secular Bull and Bear Markets The strong performance of the S&P 500 in 2023 and 2024 could be seen as a clear indication of a more sustained secular bull market, potentially extending until the late 2020s and early 2030s. Image: BofA Global Research Click the Image to Enlarge