Jul
17
2024
Off
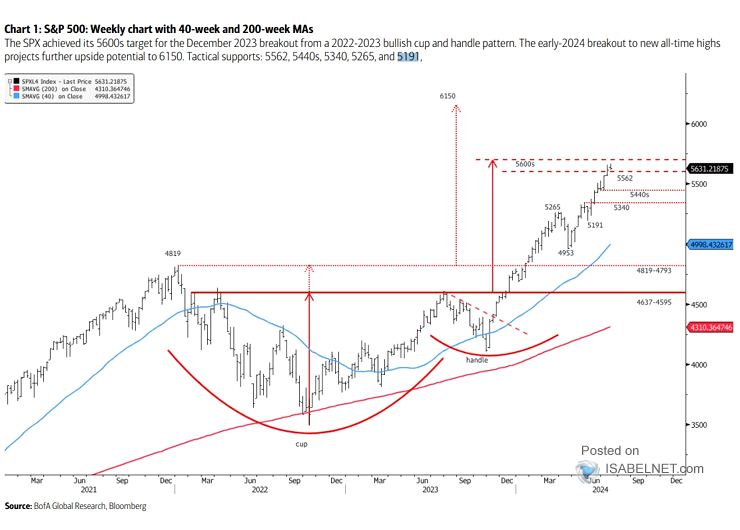
Secular Bull Market - S&P 500 Weekly Chart with the 40-Week MA and 200-Week MA
The S&P 500 has reached the 5600s target based on the bullish cup and handle pattern that formed in 2022-2023. The early-2024 breakout to new all-time highs projects further upside potential to the 6150 level.
Image: BofA Global Research
