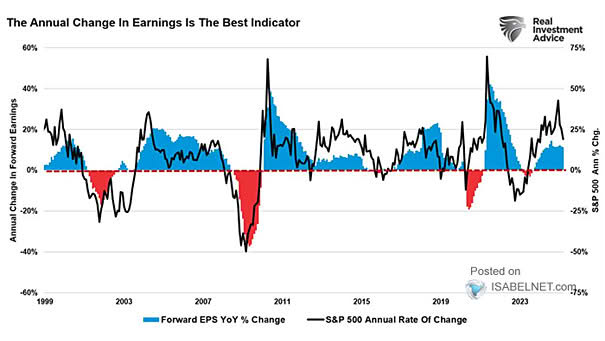
S&P 500 Intra-Year Declines vs. Calendar Year Returns

S&P 500 Intra-Year Declines vs. Calendar Year Returns Even with average intra-year drops of 14.1%, the S&P 500 achieved positive annual returns in 34 out of the past 45 years, highlighting the importance of staying…

Earnings Growth – Mag 7 and S&P 500 ex-Mag 7

Earnings Growth – Mag 7 and S&P 500 ex-Mag 7 While the pace of earnings growth for the Magnificent Seven is expected to moderate from the explosive gains of recent years, they are still forecast…

U.S. Federal Debt Held by the Public

U.S. Federal Debt Held by the Public The U.S. public debt has reached unprecedented levels both in absolute terms and relative to the economy, raising significant concerns about the country’s fiscal sustainability and economic future.…

Valuation – 12-Month Forward P/E Ranges (MSCI Regions)

Valuation – 12-Month Forward P/E Ranges (MSCI Regions) The high valuation levels seen today in U.S. and global equity markets often suggest a risk of reduced future returns, unless earnings growth picks up enough to…

Global Gold Reserves vs. Global Dollar Reserves

Global Gold Reserves vs. Global Dollar Reserves Amid rising geopolitical tensions and a shifting global financial landscape, central banks worldwide are increasingly favoring gold over the U.S. dollar as a reserve asset. Image: Blomberg

Market-Implied U.S. Recession Probability

Market-Implied U.S. Recession Probability The market-implied probability suggests a modestly elevated risk of a U.S. recession within the next year, slightly above its long-term average. Image: Goldman Sachs Global Investment Research

U.S. Stock Market Bull and Bear Indicator

U.S. Stock Market Bull and Bear Indicator Using multiple financial data, this great model helps investors navigate through different market conditions. It suggests whether the U.S. stock market tendency is bullish, bearish or neutral. It…