U.S. Nonfarm Payrolls vs. U.S. ISM Manufacturing PMI

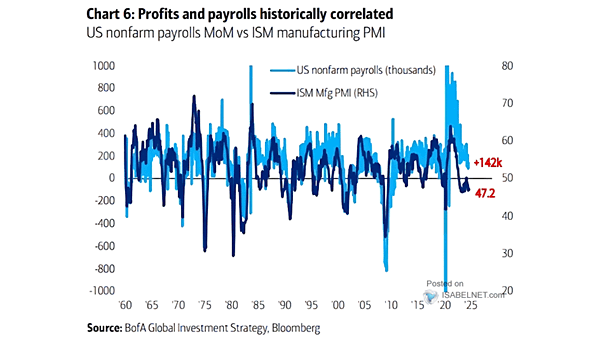
U.S. Nonfarm Payrolls vs. U.S. ISM Manufacturing PMI The U.S. ISM manufacturing index reading below 50 signals a contraction in manufacturing activity, which may impact payroll numbers. However, the relationship between the index and actual payroll figures is not straightforward. Image: BofA Global Investment Strategy
Change in Nonfarm Payrolls

Change in Nonfarm Payrolls Consensus expectations for the August non-farm payrolls report suggest an increase of approximately 165,000 jobs, while the U.S. unemployment rate is projected to decline to 4.2%. Image: Goldman Sachs Global Investment Research

U.S. Labor Market – U.S. Nonfarm Payrolls vs. Retail Sales

U.S. Labor Market – U.S. Nonfarm Payrolls vs. Retail Sales Higher payrolls can potentially lead to higher retail sales, as increased income for employees can result in greater purchasing power. Image: BofA Global Investment Strategy

ISM Manufacturing PMI and Nonfarm Payroll Growth vs. U.S. Election Outcome

ISM Manufacturing PMI and Nonfarm Payroll Growth vs. U.S. Election Outcome Chart showing the relationship between growth trends into U.S. elections and the margin of victory or defeat for incumbent candidates. Historically, the probability of incumbents winning an election increases, as growth trends improve. Image: Bessemer Trust

S&P 500 Return vs. NonFarm Payrolls

S&P 500 Return vs. NonFarm Payrolls Since 1988, the cumulative return of the S&P 500 has been much better when nonfarm payrolls have exceeded 100,000. Image: Pictet Wealth Management

U.S. Consumer Spending and Nonfarm Payroll Growth

U.S. Consumer Spending and Nonfarm Payroll Growth U.S. consumers may spend less going forward. Slower job growth usually leads to a slowdown in consumer spending. Image: BofA Merrill Lynch Global Research