S&P 500 Cycle Composite
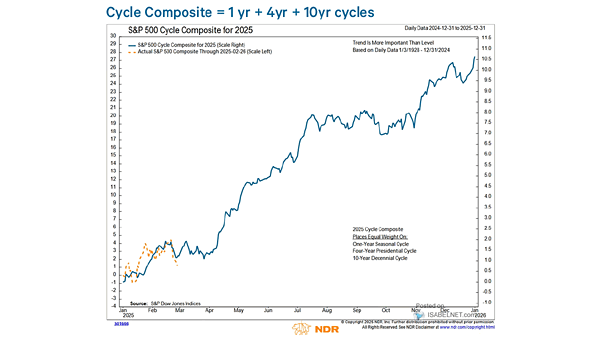
S&P 500 Cycle Composite Based on the S&P 500 Cycle Composite forecast, an uptrend is expected to start around this time and continue through the first week of March 2025. Image: Ned Davis Research
S&P 500 Cycle Composite Based on the S&P 500 Cycle Composite forecast, an uptrend is expected to start around this time and continue through the first week of March 2025. Image: Ned Davis Research
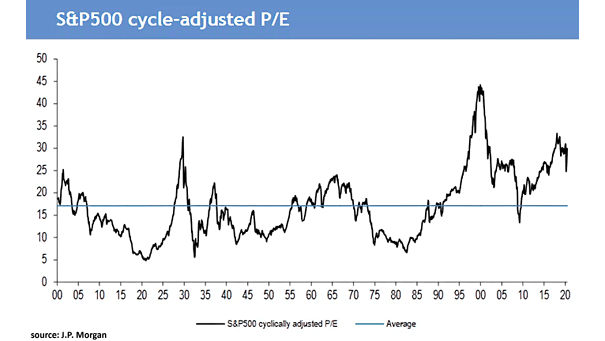
S&P 500 Cycle-Adjusted P/E The S&P500 cycle-adjusted P/E is now 29.9 and 75% above its long-term average, suggesting weak equity returns over the next 10 years. Image: J.P. Morgan

Seasonality – S&P 500 Cycle Composite for 2019 This great chart shows the S&P 500 cycle composite for 2019 vs. the actual S&P 500 composite (places equal weight on: one-year seasonal cycle, four-year presidential cycle, and 10-year decennial cycle). This is not a forecast. Image: Ned Davis Research
S&P 500 Seasonal Composite 4 Year Presidential Election Cycle The S&P 500’s behavior in 2025 continues to align with the presidential election 4-year seasonal cycle, which provides a useful framework. Image: Nautilus Research
S&P 500 Index Returns Based on 4-Year Presidential Cycle Post-election years typically bring strong market gains. Since 1985, the S&P 500 has averaged gains of over 18%, with positive returns in 90% of cases. The real concern, however, lies in the year that follows. Image: Carson Investment Research
S&P 500 Index Quarterly Returns Based on the Four-Year Presidential Cycle In post-election years, Q1 tends to be weak. Q2 often shows stronger performance, while Q3 usually experiences some weakness. As the saying goes, “History doesn’t repeat itself, but it often rhymes.” Image: Carson Investment Research
S&P 500 Four-Year Cycle Although the S&P 500 is facing increased volatility in this post-election year, its performance still aligns with typical patterns observed in the four-year presidential cycle. Image: Ned Davis Research
Cycle Composite for the S&P 500 While the market may face some choppiness in the near term, the Carson Cycle Composite’s prediction of a strong 2025 for U.S. stocks gives bulls reason for confidence. Image: Carson Investment Research
S&P 500 Performance per Year of a 4-Year Presidential Cycle The U.S. stock market typically outperforms in the first two years of a President’s second term compared to a new President’s term, suggesting a potentially strong year for stocks and giving bulls reason to smile. Image: Carson Investment Research
S&P 500 Monthly Returns and Percentage of Time Up – Presidential Cycle Year 4 Seasonality provides valuable insights into stock market trends. Historically, after experiencing weaknesses in September and October during election years, the S&P 500 tends to rebound with strong returns in November and December. Image: BofA Global Research
EPS Growth – Political Party and S&P 500 Profits Cycle While election results can impact markets in the short term, the underlying profitability of companies is a stronger driver of stock prices over time. Image: BofA US Equity & US Quant Strategy