Copper/Gold Ratio vs. U.S. 10-Year Yield
Copper/Gold Ratio vs. U.S. 10-Year Yield The copper to gold ratio tends to lead the 10-year U.S. Treasury yield. Image: Strategas Research Partners
10-Year Yield: U.S. vs. G10 excluding U.S. Should investors expect global bond yields to fall? Image: Alpine Macro
Eurozone – 10-Year Yields by Country One currency in the eurozone, but so many different interest rates. Can the eurozone survive in the long term? Image: BofA Global Investment Strategy
U.S. 10-Year Yields and Peak in U.S. 2-Year Yields Will U.S. Treasury yields peak once the Fed finishes tightening? Image: Goldman Sachs Global Investment Research
Total Equity Flows Minus Bond Flows and U.S. 10-Year Yield Will the rotation in fund flows from bonds to equities continue? Image: Deutsche Bank Asset Allocation
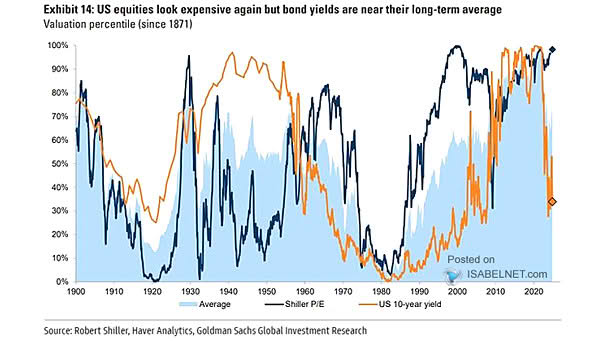
Valuation – Shiller P/E and U.S. 10-Year Yield Where to invest when U.S. markets look expensive? Image: Goldman Sachs Global Investment Research
S&P 500 Index Returns Under a Higher 10-Year Yield Historically, higher rates tend to be bullish for the S&P 500. Image: LPL Research
Valuation Percentile for S&P 500 and U.S. 10-Year Yields How long will valuations remain near their all-time highs? Image: Goldman Sachs Global Investment Research
China Credit Impulse and U.S. Generic Government 10-Year Yield (Leading Indicator) China’s credit impulse tends to lead the U.S. 10-year bond yield by 12 months. Is it time to buy long-dated bonds? Image: Nordea and Macrobond
U.S. 10-Year Yield and U.S. 10-Year TIPS Breakeven So far, the U.S. 10-year yield and the U.S. 10-year TIPS breakeven continue to follow the historical pattern after global recoveries. Image: Arbor Research & Trading LLC