U.S. Market Concentration Indicator
U.S. Market Concentration Indicator U.S. market concentration has declined substantially. Image: Alpine Macro
Stock Market Concentration – S&P 500, STOXX Europe 600 and Topix The S&P 500 remains highly concentrated in a few stocks. Image: Goldman Sachs Global Investment Research
U.S. Market Concentrations – Top 500 Stocks U.S. market concentrations are breaking down. Image: Morgan Stanley Research
S&P 500 Stocks and Stock Market Concentration Is this level of stock concentration a cause for concern? Image: BofA Global Investment Strategy
China Pollutant Concentration in Shanghai Chart suggesting that production in China is resuming, as air pollution in Shanghai is increasing. Image: Charles Schwab
Annual Average Temperature Anomaly and CO2 Concentration Chart showing the correlation between CO2 concentration and annual average temperature anomaly. Image: Morgan Stanley Research
Inequality – Concentration of Equities Ownership by Wealth Class in the U.S. The top 1% of households owns equities, while the bottom 50% of households owns real estate. Image: Goldman Sachs Global Investment Research
Climate – CO2 Concentration and Temperature over 800,000 Years This interesting chart shows the correlation between CO2 concentration and temperature over 800,000 years. Image: J.P. Morgan
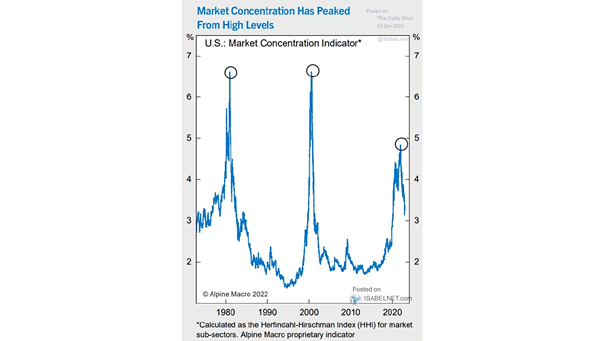
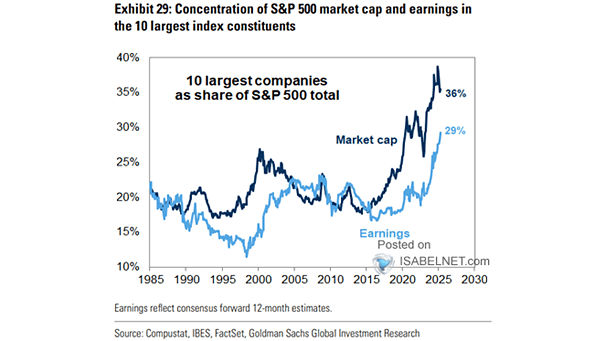
Equity Market Concentration – Market Capitalization of 10 Largest Companies as Share of S&P 500 Total The market capitalization of the 10 largest companies as share of S&P 500 total is significantly above average. Image: Goldman Sachs Global Investment Research
Inequality – Concentration of Stock Ownership by Wealth Class in the U.S. The top 1% own 50% of stocks held by American households. Image: Yahoo! Finance