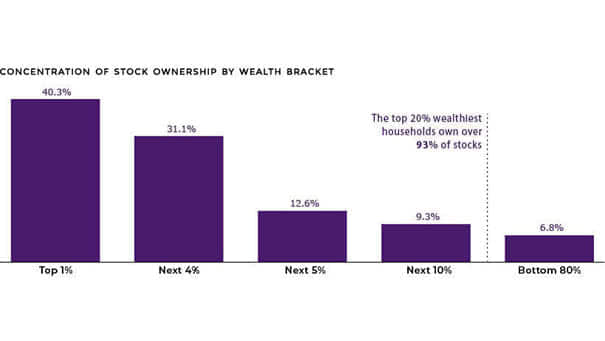
Concentration of Stock Ownership by Wealth Bracket
Concentration of Stock Ownership by Wealth Bracket As the chart shows, the top 20% wealthiest American households own over 93% of stocks. You may also like “How the Composition of Wealth Changes from the Middle Class to The Ultra Rich?” and “U.S. Net Worth by Wealth Bracket.” Image: Visual Capitalist