Personal Saving Rate and U.S. Household
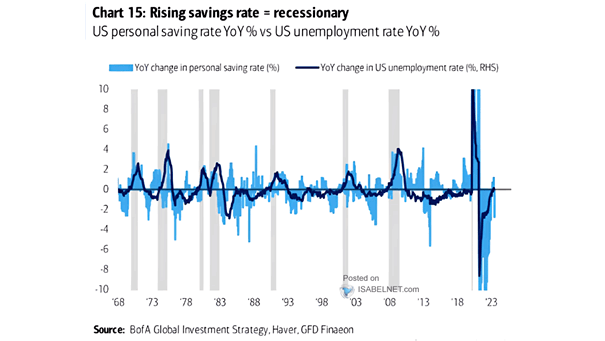
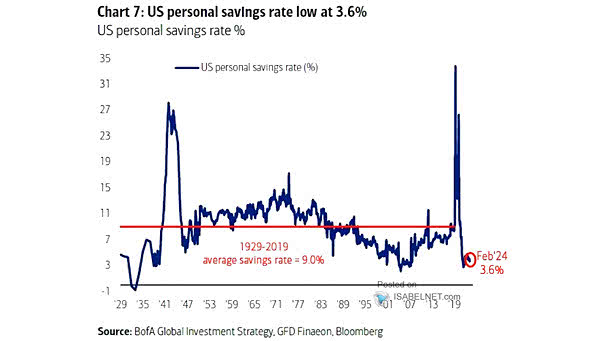
Personal Saving Rate and U.S. Household The U.S. personal saving rate remains well below its long-term average, reflecting a trend of decreased savings and raising concerns about individuals’ financial security. Image: BofA Research Investment Committee