NAR U.S. Pending Home Sales Index
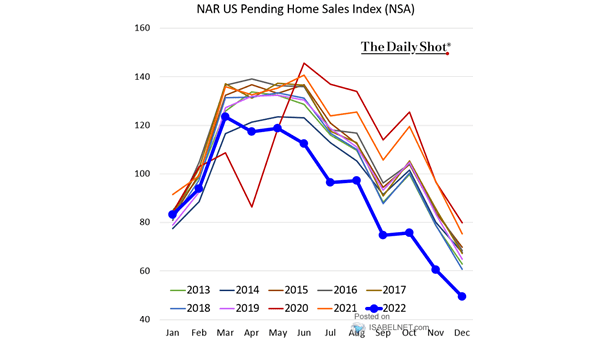
NAR U.S. Pending Home Sales Index U.S. pending home sales dropped by 33.8% YoY in December. Image: The Daily Shot
NAR U.S. Pending Home Sales Index U.S. pending home sales dropped by 33.8% YoY in December. Image: The Daily Shot
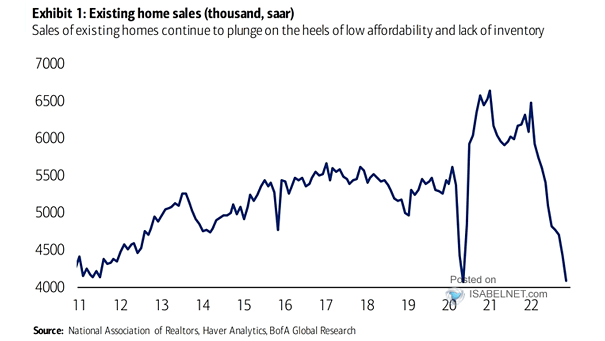
U.S. Existing Home Sales High mortgage rates do not bode well for existing home sales in the United States. Image: BofA Global Research

Housing Market – U.S. Pending Home Sales Recession is coming in the United States. U.S. pending home sales, down 30% from a year ago, are a good leading indicator of the housing market. Image: BofA Global Investment Strategy
Housing – U.S. Existing Home Sales U.S. existing home sales fell 1.5% in September as rates rise. Image: The Daily Shot
Housing – % of New U.S. Home Sales by Price Range The share of new home sales over $500,000 is increasing. Image: BofA Global Research
Housing – U.S. Existing Home Sales: Median Price and Inventory The inventory of homes for sale in the U.S. is now very low, with home prices expected to keep climbing. Image: Morgan Stanley Wealth Management
U.S. Housing – Existing Home Sales Price U.S. house prices rise much faster than wages and become too expensive for most young people. Image: BofA Global Investment Strategy
U.S. Existing Home Sales Median Price U.S. existing home prices rise as tight supply pushes prices higher. Image: Piper Sandler
U.S. Housing – Existing Home Sales Median Price Existing home sales reached their highest level in 14 years, thanks to low rates. Image: Piper Sandler
Housing – U.S. Existing Home Sales and 30-Year Mortgage Rate This chart shows the correlation between U.S. existing home sales and the 30-year mortgage rate (inverted), and suggests further improvements in sales. Image : Piper Sandler Companies
New Home Sales vs. Recessions Typically, a recession occurs when the annual change in New Home Sales declines by about 20%. This chart suggests that a recession from these levels would be surprising. Image: Calculated Risk