Different Market Sentiment Indicators
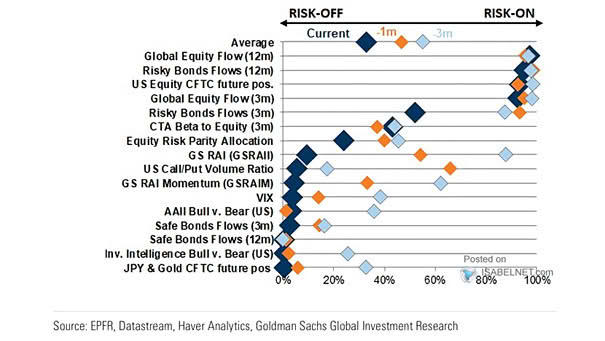
Different Market Sentiment Indicators Current market sentiment indicators confirm a prevailing risk-on attitude, with investors showing greater confidence and willingness to invest in higher-risk assets. Image: Goldman Sachs Global Investment Research