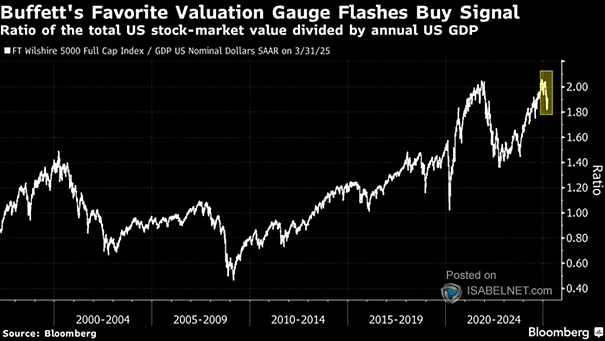
Risk Appetite Indicator for Different Asset Classes

Risk Appetite Indicator for Different Asset Classes Investors have sharply shifted toward risk aversion due to escalating tariff policies and eroding market visibility. Image: Goldman Sachs Global Investment Research

Average Percentile of Sentiment Indicators

Average Percentile of Sentiment Indicators While sentiment and positioning were highly bullish at the end of 2024, recent setbacks have emerged. The resurgence of “Trumponomics” has increased volatility, prompting investors to adopt more defensive strategies. Image: Goldman Sachs Global Investment Research

Market Sentiment Indicator

Market Sentiment Indicator Morgan Stanley’s market sentiment indicator has recently turned positive, signaling a shift towards a risk-on appetite after maintaining a neutral stance. Image: Morgan Stanley Research

Fed Funds vs. 2-Year U.S. Treasury Yield (Leading Indicator)

Fed Funds vs. 2-Year U.S. Treasury Yield (Leading Indicator) The current 2-year U.S. Treasury yield, sitting below the fed funds rate, indicates that the Fed’s monetary policy is restrictive. Historically, the 2-year yield tends to lead the fed funds rate by approximately 20 weeks. Image: Bloomberg

U.S. Equity Sentiment Indicator

U.S. Equity Sentiment Indicator With the year-end approaching, sentiment is overly stretched, implying that market participants might be excessively optimistic and overconfident in their bullish outlook. Image: Goldman Sachs Global Investment Research

Sell Side Consensus Indicator

Sell Side Consensus Indicator The Sell Side Indicator, which tracks Wall Street strategists’ equity allocation recommendations, has remained unchanged in September. The current level suggests that the S&P 500 may see positive gains over the next 12 months. Image: BofA US Equity and Quant Strategy

Yield Curve vs. VIX (Leading Indicator)

Yield Curve vs. VIX (Leading Indicator) Should U.S. equity investors anticipate increased volatility ahead, given that the yield curve typically leads the VIX by three years? Image: BofA US Equity & Quant Strategy

S&P 500 Going into a Sahm Rule Recession Indicator Trigger Event

S&P 500 Going into a Sahm Rule Recession Indicator Trigger Event The recent triggering of the Sahm Rule indicator has diverged from the typical behavior of U.S. equities seen in the lead-up to a recession. Investors should be cautious before drawing conclusions about a potential U.S. recession. Image: BofA Predictive Analytics