S&P 500 Free Cash Flow
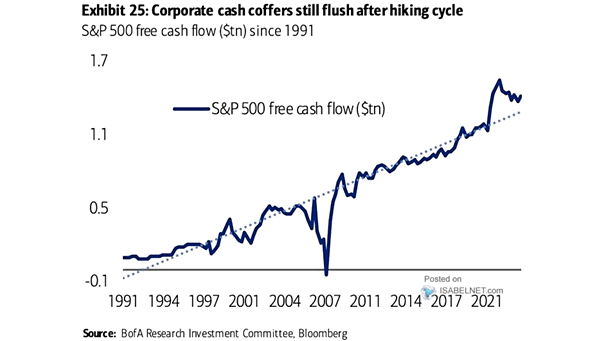
S&P 500 Free Cash Flow Despite a decline, the S&P 500 free cash flow remains higher than the historical trend, even during the current hiking cycle. Image: BofA Research Investment Committee
S&P 500 Free Cash Flow Despite a decline, the S&P 500 free cash flow remains higher than the historical trend, even during the current hiking cycle. Image: BofA Research Investment Committee
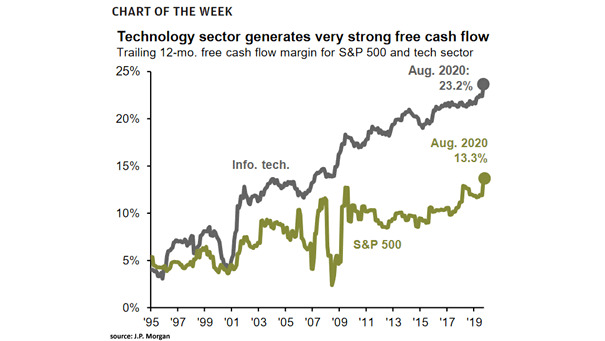
Free Cash Flow Margin for S&P 500 and Tech Sector The free cash flow margin for the tech sector has risen from less than 5% in the aftermath of the Internet bubble to more than 23% today. Image: J.P. Morgan Asset Management

Shareholder Return vs. Free Cash Flow Thanks to low interest rates, shareholder return has exceeded free cash flow levels again. U.S. companies cannot spend more than they earn indefinitely. Image: Goldman Sachs Global Investment Research
Dividends and Buybacks vs. Free Cash Flow Dividends and buybacks have exceeded free cash flow levels again, thanks to low interest rates. But companies cannot spend more than they earn forever. Image: Capital Group
Cross-Asset Valuation for the U.S. On an absolute basis, equities look expensive by historical standards, but relative valuations appear attractive, as free cash flow yield and ERP look cheap. Image: Goldman Sachs Global Investment Research
Does Quantitative Easing Affect Valuation? More fundamentally, low interest rates, high margins, low taxes, buybacks & free cash flow drive stocks higher. Image: Fidelity Investments
S&P 500 Payout Ratio Stock buybacks and dividends as a percentage of free cash flow are reaching dangerous levels. Image: MarketWatch