Performance of U.S. vs. Rest of World Equities

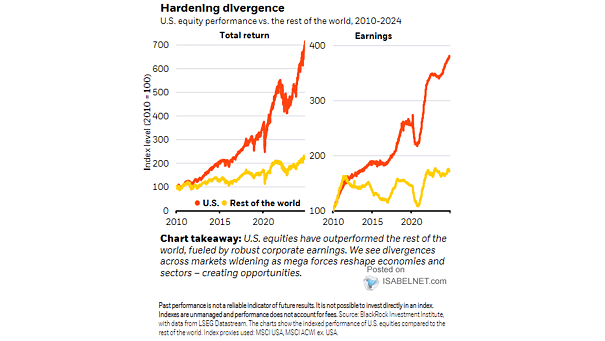
Performance of U.S. vs. Rest of World Equities Investing in U.S. corporations is like betting on a horse that always finishes the race—sure, it might stumble, but it usually crosses the finish line ahead of the pack! Image: BlackRock Investment Institute
World Equities and U.S. 10-Year Treasury Yield

World Equities and U.S. 10-Year Treasury Yield Chart suggesting that the round trip in U.S. Treasury yields explains the round trip in stock market valuation. Image: Financial Times

Valuation – U.S. Equities vs. Rest of World – 12-Month Forward PE Ratios

Valuation – U.S. Equities vs. Rest of World – 12-Month Forward PE Ratios U.S. equities trade at historically high valuations versus global peers, with the premium widening. While strong fundamentals support this, it also poses risks if growth expectations decline or macroeconomic conditions worsen. Image: Deutsche Bank

Seasonality Trends in MSCI AC World Index (Global Equities)

Seasonality Trends in MSCI AC World Index (Global Equities) July has historically been a strong month for global equities, offering opportunities for investors to capture potential gains. Image: BofA Global Quantitative Strategy

Valuation – World Technology Equities

Valuation – World Technology Equities Rising bond yields could hurt the tech sector, as it is very sensitive to higher yields. Image: BCA Research

U.S. vs. World ex-U.S. Equities

U.S. vs. World ex-U.S. Equities Is it a major turning point for the U.S. stock market? Image: BofA Global Investment Strategy

U.S. Equities and The World: Earnings Growth vs. Multiple Expansion

U.S. Equities and The World: Earnings Growth vs. Multiple Expansion Since the 2009 low, the strong performance of the U.S. markets comes from earnings growth (73%) and multiple expansion (27%). You may also like “S&P 500 Return: Earnings Growth vs. Multiple Expansion.” Image: Goldman Sachs Global Investment Research