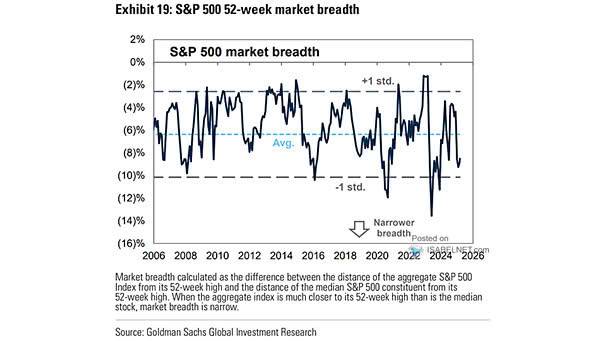
Market – Breadth Index

Market – Breadth Index The market’s performance is disproportionately driven by a small number of U.S. stocks, as evidenced by the low Goldman Sachs Breadth Index, rather than reflecting a widespread rally across the market. Image: Goldman Sachs Global Investment Research

S&P 500 Index Returns – Zweig Breadth Thrust Signals Since WWII

S&P 500 Index Returns – Zweig Breadth Thrust Signals Since WWII The Zweig Breadth Thrust, a rare occurrence, has historically indicated strong S&P 500 performance over the next 6 and 12 months, with a median increase in value of 24.8% one year later since 1945. Image: Carson Investment Research

S&P 500 and Zweig Breadth Thrust

S&P 500 and Zweig Breadth Thrust The Zweig Breadth Thrust, which is a rare occurrence, has historically been a strong indicator of S&P 500 performance over the next 6 and 12 months, with an average increase in value of 23.3% one year later since 1945. Image: Carson Investment Research

S&P 500 Earnings Revisions Breadth

S&P 500 Earnings Revisions Breadth S&P 500 earnings revision breadth remains in negative territory, suggesting that there is still a cautious outlook for future earnings of S&P 500 companies. Image: Morgan Stanley Research

S&P 500 Earnings Revisions Breadth

S&P 500 Earnings Revisions Breadth Earnings revisions breadth for both large and small caps has returned to negative territory, which means that the overall sentiment and expectations for future earnings have worsened. Image: Morgan Stanley Research

S&P 500 Earnings Revisions Breadth vs. S&P 500 YoY

S&P 500 Earnings Revisions Breadth vs. S&P 500 YoY The decline in earnings revisions breadth and its deviation from the S&P 500 performance suggests a disparity between analyst expectations for corporate earnings and the actual trajectory of the S&P 500. Image: Morgan Stanley Research

S&P 500 Performance Around Narrowing Market Breadth Episodes

S&P 500 Performance Around Narrowing Market Breadth Episodes A sharp narrowing market breadth does not necessarily indicate a negative return for the S&P 500 over the next 12 months. Image: Goldman Sachs Global Investment Research

Breadth and S&P 500

Breadth and S&P 500 The persistence of more new lows than new highs does not bode well for the S&P 500. Image: All Star Charts