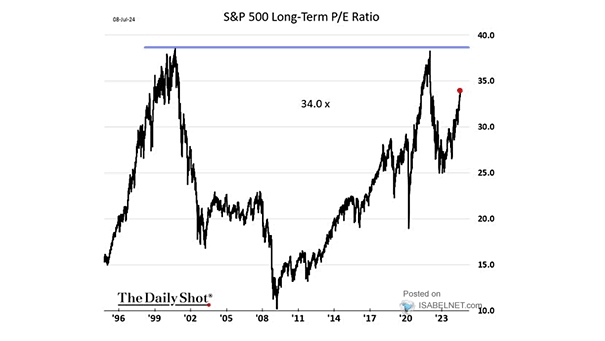
S&P 500 Forward P/E Ratio and Subsequent 5-Year Returns

Forward P/E Ratio and Subsequent 5-Year Annualized Returns With U.S. stocks trading at stretched multiples, the era of easy money in equities seems to be fading, making patience the smarter play for the next five years. Image: J.P. Morgan Asset Management

U.S. Stock Market Valuations – Combined P/E Ratio

U.S. Stock Market Valuations – Combined P/E Ratio High P/E ratios in U.S. tech stocks cut both ways — they highlight the sector’s strong growth prospects but also the danger of valuations inflated by unbridled investor optimism. Image: Topdown Charts

Valuation – S&P 500 Index Forward P/E Ratio

Valuation – S&P 500 Index Forward P/E Ratio The market is no bargain: the S&P 500 sits at 23 times forward earnings, versus 16 on average over two decades, while the Magnificent Seven stretch valuations even further at 31. Image: Bloomberg

Valuation – S&P 500 Median P/E Ratio

Valuation – S&P 500 Median P/E Ratio The S&P 500’s median P/E ratio sits at 26.2—a level that leaves stocks looking pricey and raises the odds of thinner returns or a valuation pullback if history is any guide. Image: Ned Davis Research

U.S. Equities – 12-Month Forward P/E Ratio and Share Prices

U.S. Equities – 12-Month Forward P/E Ratio and Share Prices Market optimism is fueled by hopes of resolving trade and geopolitical risks, but high S&P 500 valuations increase vulnerability. Without resolution or robust earnings growth, the risk of a market pullback rises. Image: Deutsche Bank

Valuation – S&P 500 Company Actual vs. Modeled FY2 P/E Ratio

Valuation – S&P 500 Company Actual vs. Modeled FY2 P/E Ratio Valuations for the Magnificent Seven now sit slightly below modeled fair value, especially in light of their robust fundamentals and earnings growth. Image: Goldman Sachs Global Investment Research

Valuation – S&P 500 12-Month Forward P/E Ratio

Valuation – S&P 500 12-Month Forward P/E Ratio The S&P 500’s forward P/E ratio of 20x places it above historical averages, reinforcing the view that current valuations are not historically cheap. Image: The Daily Shot

Valuation – Bloomberg Magnificent Seven Price Return Index – Best P/E Ratio

Valuation – Bloomberg Magnificent Seven Price Return Index – Best P/E Ratio During the recent market selloff, valuations of major tech companies have plummeted from their previous highs. Many traders believe the downward trend may continue, a sentiment supported by recent historical patterns. Image: Bloomberg

S&P 500 Valuation – Shiller P/E Ratio at the Start of Presidency

S&P 500 Valuation – Shiller’s Cyclically-Adjusted Price-To-Earnings (CAPE) Ratio With the Shiller P/E ratio indicating an unusually high valuation for the U.S. stock market compared to the start of previous presidential terms, investors may need to moderate their expectations for future returns. Image: The Wall Street Journal