Valuation – S&P 500 Operating Earnings Per Share
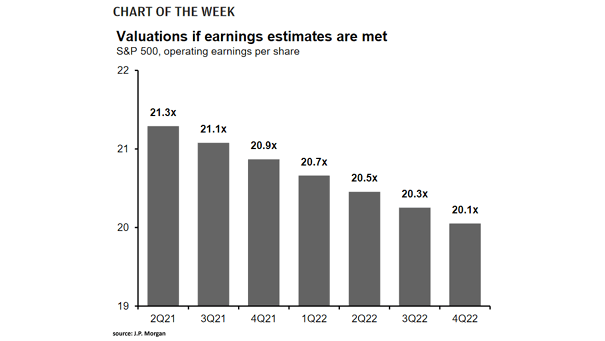
Valuation – S&P 500 Operating Earnings Per Share If companies are able to maintain their profit margins, the forward P/E ratio of the S&P 500 could fall to 20.1x by 4Q22. Image: J.P. Morgan Asset Management