U.S. Debt-to-GDP vs. U.S. Treasury 10-Year Rate
U.S. Debt-to-GDP vs. U.S. Treasury 10-Year Rate Low U.S. interest rates also make public debt less costly. Image: Piper Sandler
U.S. Debt Balance by Age Bracket Debt among oldest Americans increased 543% from 1999 through 2019. Image: CNBC
U.S. Debt Growth vs. Real GDP Growth Chart showing that the United States is on an unsustainable path, because U.S. debt is growing faster than the economy. Image: Real Investment Advice
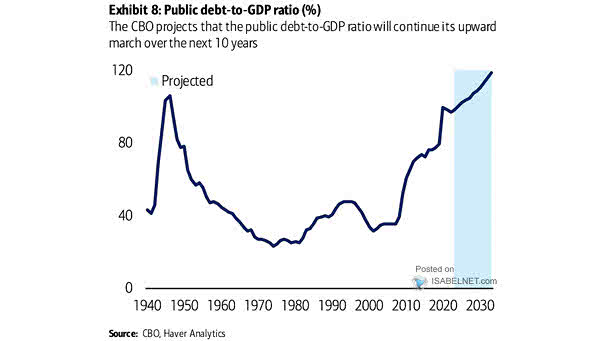
U.S. Debt Held by Public as Share of GDP U.S. federal debt is expected to grow rapidly and could increase the likelihood of a fiscal crisis in the future. Image: Deutsche Bank
U.S. Debt and Demographics This interesting chart clearly shows the large divergence between U.S. debt and demographics. Image: Fidelity Investments
U.S. Debt Ceiling and U.S. Nominal GDP The statutory debt limit, also called the debt ceiling, is the statutory maximum of money the U.S. Treasury is allowed to borrow.Now, it is higher than U.S. nominal GDP. Image: Jeroen Blokland
Foreign Holders of U.S. Debt Currently, China and Japan hold the most U.S. debt. Image: howmuch.net
U.S. Debt Ratios to GDP (Household, Corporate, Government) U.S. households remain far less in debt than during the Great Recession, but U.S. corporate debt continues to rise rapidly and has exceeded record levels . Image: Pictet Wealth Management
U.S. Debt Markets An interesting chart showing the breakdown of U.S. debt markets. Image: Bianco Research
U.S. Debt to Nominal GDP Ratios from 1975 to 2019 Government debt: 97.2% of Nominal GDPHousehold debt: 76.4% of Nominal GDPNon-financial corporate debt: 73.9% of Nominal GDP You may also like “Is U.S. Household Debt a Problem?“ Image: J.P. Morgan Asset Management “Guide to the Markets” for Q2 2019