Volatility Divergence – VIX and MOVE
Volatility Divergence – VIX and MOVE The volatility divergence between VIX and MOVE remains elevated. Image: Gavekal, Macrobond
China GDP – Longer-Term Growth Divergence Between China and the Rest of the World The divergence between China and the rest of the world is expecting to increase over time. Image: Deutsche Bank
Volatility Divergence – VIX vs. MOVE
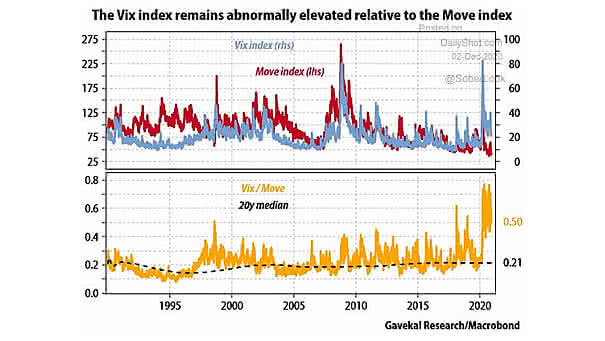
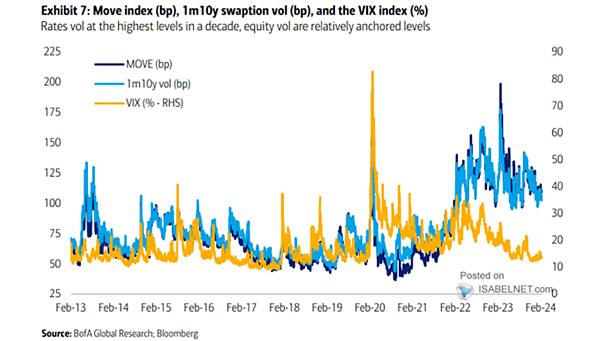
 When MOVE is below the 50th percentile and VIX is above the 80th percentile, the average annualized S&P 500 price performance has been close to +21% compared to just over +7% the rest of the time. Image: Bloomberg
U.S. Stocks and U.S. Bonds: Returns Following Fund Flow Divergence In 2019, bond fund flows outpaced stock fund flows. The difference is the largest ever recorded ($588bn). Image: BlackRock Investment Institute
Divergence Between the 2-Year U.S. Treasury Yield and the U.S. Dollar Trump wants a weaker US dollar, but could the dollar weaken in the coming months? Image: Legg Mason
Russell 2000/Nasdaq 100 and Real U.S. 10-Year Yields This chart highlights the current divergence between real U.S. 10-year yields and the Russell 2000 relative to the Nasdaq 100. Image: Morgan Stanley Research
Discretionary vs. Systematic Equity Positioning There is a wide divergence between systematic equity positioning at 29th percentile and discretionary equity positioning at 85th percentile. Image: Deutsche Bank Asset Allocation
Corporate Profits After Tax vs. S&P 500 Do valuations still matter? The current divergence between the S&P 500 and corporate profits after tax is the widest on record. Image: Real Investment Advice
Russell 1000 American Stock Index – Growth vs. Value The gap between growth and value has widened considerably. It is now the largest divergence in decades. Image: The Economist
S&P 500 EPS vs. U.S. NIPA Corporate Profits This chart puts into perspective the wide divergence between S&P 500 EPS and U.S. NIPA corporate profits. Image: BofA Research Investment Committee