S&P 500 vs. ISM Composite PMI

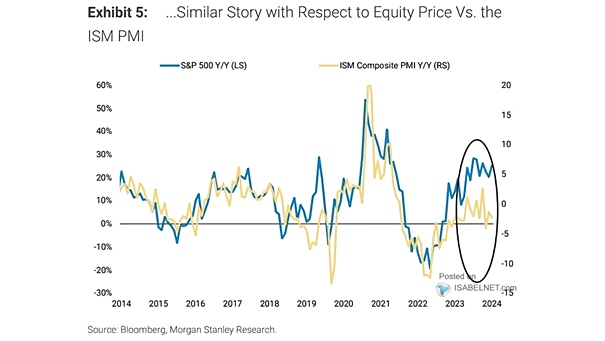
S&P 500 vs. ISM Composite PMI The divergence between the U.S. ISM Composite PMI and the S&P 500 has become increasingly notable, reflecting contrasting signals about the health of the U.S. economy. Image: Morgan Stanley Research

Percentage of S&P 500 Stocks Above 200-Day Moving Average

Percentage of S&P 500 Stocks Above 200-Day Moving Average The percentage of S&P 500 stocks above their 200-day moving average is showing signs of a bearish divergence, which can be an early warning signal of a potential market correction. Image: BofA Global Research

S&P 500 and the Percentage of Stocks Above 10-Day MAs

S&P 500 and the Percentage of Stocks Above 10-Day MAs The rise in the percentage of S&P 500 stocks above their 10-day moving averages can be interpreted as a tactical bullish divergence, providing valuable insights into market strength and the potential for a reversal. Image: BofA Global Research

U.S. Dollar vs. S&P 500

U.S. Dollar vs. S&P 500 The market is responding positively to good news, as indicated by the recent divergence between the S&P 500 and the U.S. dollar (inverted). This suggests a renewed sense of optimism in the market. Image: BofA US Equity & Quant Strategy

S&P 500 McClellan Oscillator

S&P 500 McClellan Oscillator The bullish divergence in the S&P 500 McClellan oscillator implies underlying buying pressure, signaling positivity for U.S. stocks and increasing the likelihood of a market reversal or bounce back. Image: BofA Global Research

PMI vs. Equity Risk Premium

PMI vs. Equity Risk Premium The divergence between the ISM PMI and the equity risk premium is significant. Image: Morgan Stanley Research

Gold and the Misery Index

Gold and the Misery Index The divergence between gold and the misery index is widening. Image: BofA Global Research

S&P 500 and Investment Grade Bonds

S&P 500 and Investment Grade Bonds The divergence between investment grade bonds and the S&P 500 tends to be a bearish signal for the S&P 500. Image: BofA Global Research