U.S. Debt and Demographics
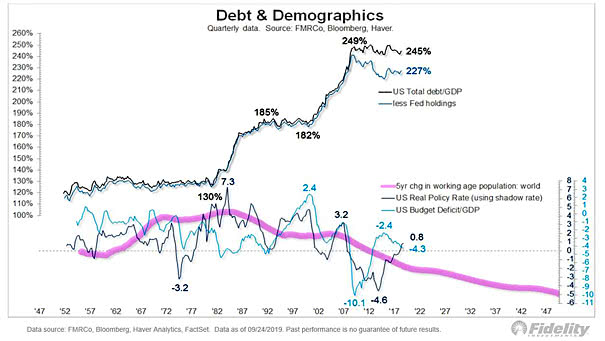
U.S. Debt and Demographics This interesting chart clearly shows the large divergence between U.S. debt and demographics. Image: Fidelity Investments
U.S. Debt and Demographics This interesting chart clearly shows the large divergence between U.S. debt and demographics. Image: Fidelity Investments
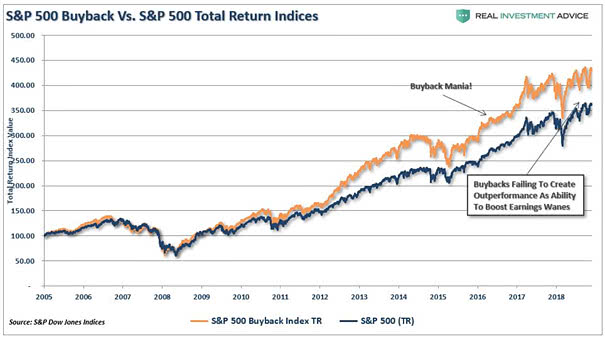
S&P 500 Buyback Index vs. S&P 500 Total Return Index This chart clearly shows the large divergence between the S&P 500 Buyback Index and the S&P 500 Total Return Index. Image: Real Investment Advice

U.S. Industrial Production and GDP This chart clearly shows the divergence between U.S. industrial production and GDP, since the financial crisis. Image: Gavekal, Macrobond
S&P 500 Operating EPS vs. USA National Income, Corporate Profits Thanks to buybacks, this chart clearly shows the current divergence. Is a new bubble being formed? Image: Nordea and Macrobond
S&P 500 EPS vs. U.S. Nonfinancial Corporate Profits Creative accounting is imaginative ways to present accounts. The divergences between earnings and U.S. nonfinancial corporate profits occur before recessions. Image: Gavekal, Macrobond
Citi Global Economic Surprise Index and Baltic Dry Index The divergence between the Baltic Dry Index and the Citi Global Economic Surprise Index could suggest that “global economy is likely to bottom soon.” Image: Nomura
S&P 500 and U.S. Economic Surprises This chart shows the current divergence between the S&P 500 YoY and the 12-month moving average of the U.S. economic surprise index. Image: Oxford Economics and Macrobond
S&P 500 Index Price Average Before and After Initial Fed Rate Cut Historically, the S&P 500 Index has risen in 13 out of 16 cases after an initial Fed rate cut (since 1954). The divergence between the S&P 500 and EPS suggests that the market doesn’t care too much about other things, as long as…
U.S. Hard Data vs. Soft Data U.S. hard data is improving, but the chart shows the current divergence between U.S. hard data and soft data. Image: Arbor Research & Trading LLC
Record Valuation Dispersion 1951-2017 Today, there’s an extreme valuation divergence. The crowd invests in the most expensive part of the market. And the Value vs. Growth differential has never been so extreme, even during the Great Depression and the Dotcom bubble. Source: Sound Shore Management