S&P 500 Bear Markets
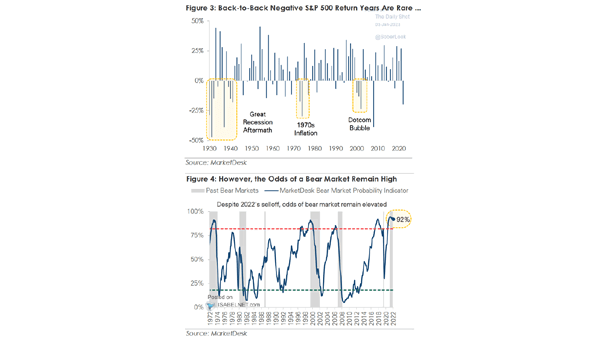
S&P 500 Bear Markets How long will the S&P 500 bear market last? Image: MarketDesk Research
S&P 500 Bear Markets How long will the S&P 500 bear market last? Image: MarketDesk Research
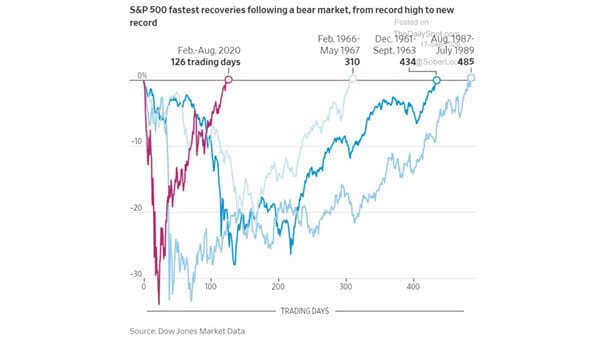
S&P 500 Bear Markets It was the fastest bear market and the fastest recovery in history. Image: The Wall Street Journal

Weeks Between S&P 500 Bear Market Bottom and Peak in Weekly Jobless Claims S&P 500 bear markets usually bottom several weeks before the peak in jobless claims. Image: Goldman Sachs Global Investment Research
S&P 500 Bear Market The percentage of stocks hitting 52-week lows and the 3-month median daily correlation, could suggest a low. Image: Truist
S&P 500 Bear Market Correction Potential This chart suggests a level of 1800 for the S&P 500 index, assuming 18x trailing earnings and $100/share due to the recession. Image: Real Investment Advice
Average S&P 500 Performance Around Bear Markets and Corrections The current drawdown in the S&P 500 has been notably sharper compared to the average bull market correction, aligning more closely with the characteristics of an average bear market. Image: Goldman Sachs Global Investment Research
S&P 500 Performance After Bear (and Near Bear) Markets End Historically, the S&P 500 has consistently rebounded and performed strongly after bear markets. It has consistently delivered positive returns in the first and second year of new bull markets since World War II. Image: Carson Investment Research
S&P 500 – Seasonality During Bull vs. Bear Markets The sell-in-May effect may be more relevant in bear markets. In bull markets, it may be seen as a missed opportunity for potential gains, given the positive momentum and upward trends typically observed in the market. Image: Topdown Charts
S&P 500 – Secular Bull and Bear Markets The strong performance of the S&P 500 in 2023 and 2024 could be seen as a clear indication of a more sustained secular bull market, potentially extending until the late 2020s and early 2030s. Image: BofA Global Research Click the Image to Enlarge
Months That S&P 500 Index Bear (and Near Bear) Markets End U.S. stocks have demonstrated a tendency to reach their lowest point of decline during the month of October, a pattern that has been observed over time. Image: Carson Investment Research