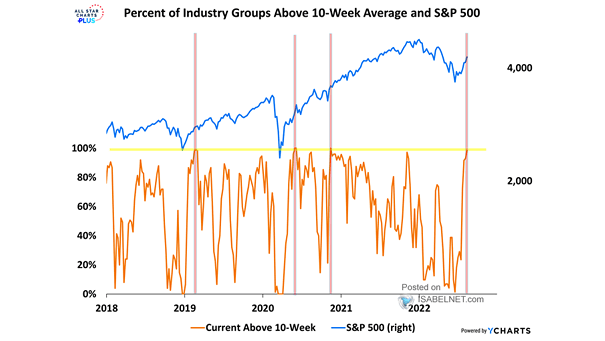
S&P 500 Industry Group Return Macro Correlations
S&P 500 Industry Group Return Macro Correlations Should investors still favor defensive value? Image: Stifel
Returns – S&P 500 Industry Group Sensitivity to Real Rates and Breakeven Inflation Should investors overweight healthcare and financials for 2022? Image: Goldman Sachs Global Investment Research
U.S. Industry Valuations – Cheap vs. Expensive The valuation differential between the cheapest vs. most expensive industries in the U.S. is at the lowest level in 20 years. Image: Topdown Charts
Performance – S&P 1500 Sub-Industry Groups Will the COVID-19 “Staying In” continue to outperform the COVID-19 “Going Out?” Image: Arbor Research & Trading LLC
Unemployment – April 2020 Expected U.S. Job Losses by Industry This chart suggests the job losses expected in April 2020 by industry in the United States. Image: Oxford Economics
Contributions to the Increase in the Unemployment Rate by Industry-Occupation Pair Goldman Sachs expects a nearly 12% increase in the U.S. unemployment rate. Image: Goldman Sachs Global Investment Research
Estimated Revenue Losses by Industry, Based on News Anecdotes This table shows the estimated revenue losses by industry, based on company announcements and press reports. Image: Goldman Sachs Global Investment Research
The Largest Industry Weighting of the Top Six Stocks in the S&P 500 The six FAANMG stocks account for 17.51% of the S&P 500. Are we seeing another tech bubble? Image: Bianco Research
World Economy – Industry as Share of Total GDP Industry represented 25% of the world’s GDP in 2018, and a larger percentage of GDP in emerging countries than in developed countries. Image: howmuch.net
Hedge Fund Industry Outperformance – Negative over Past Decade The chart below shows how it’s hard to beat the market over time. Image: Greenline Partners LLC