U.S. Business Cycle Indicator and NBER Recession
U.S. Business Cycle Indicator and NBER Recession This business cycle indicator reflects a stronger than expected recovery in the United States. Image: BofA Global Research
U.S. Business Cycle Indicator in Repair Phase Morgan Stanley’s cyclical indicator is now in the “repair” phase. Image: Morgan Stanley Research
The Four Business Cycle Phases This chart explains the four cycle phases; expansion, downturn, repair, and recovery. Image: Morgan Stanley Research
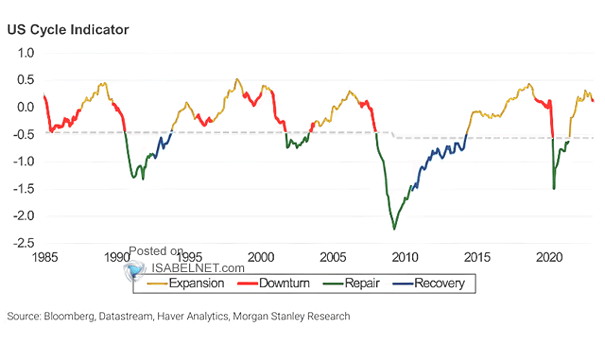
U.S. Business Cycle – Cross-Asset Cycle Indicator Morgan Stanley’s cyclical indicator is still in “downturn.” Image: Morgan Stanley Research
U.S. Business Cycle – Global Equity vs. Bonds and U.S. Unemployment Rate Chart suggesting that U.S. growth has peaked. Image: Pictet Asset Management
U.S. Business Cycle – Months of Growth vs. Months of Recession This chart puts into perspective the U.S. business cycle and the length of recessions. Image: BofA Global Research
Big-Data Analysis of the U.S. Business Cycle and NBER Recession Chart showing that the short-sample indicator improved and moved into the “Boom” regime last November. Image: BofA Global Research
Months Since Last U.S. Recession and Business Cycles The U.S. economy has experienced record growth for 127 consecutive months. This is the longest period on record. Image: Danske Bank Research, Mikael Olai Milhøj
U.S. Wage Growth and Business Cycles Despite the U.S. economic expansion is now the longest in history, wage growth has been much slower during this business cycle than in previous cycles. Image: CNBC
U.S. GDP Growth and Business Cycles Despite the current U.S. economic expansion is the longest ever, GDP growth has been much slower during this business cycle than in previous cycles. Image: CNBC