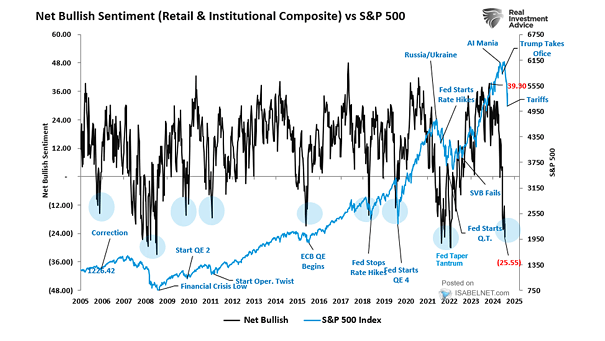
Net Bullish Sentiment vs. S&P 500 Index
Net Bullish Sentiment vs. S&P 500 Index Investor sentiment has improved significantly since the April market turmoil, driven by trade-related optimism, but it has yet to reach the extreme bullishness that typically signals market peaks. Image: Real Investment Advice