Net Bullish Sentiment vs. S&P 500 Index
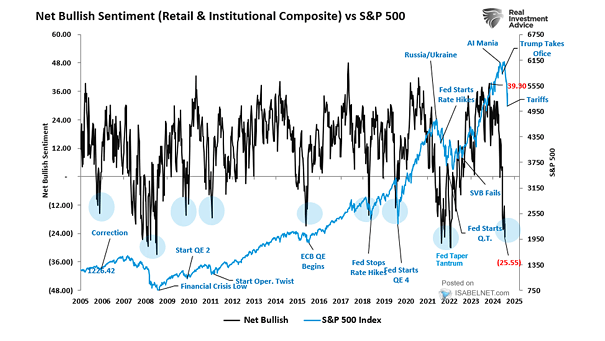
Net Bullish Sentiment vs. S&P 500 Index Investor sentiment has rebounded sharply since April’s market turmoil, buoyed by trade-related optimism, but it has not reached the excessive bullishness that usually signals a market peak. Image: Real Investment Advice