Insider Transactions Ratio
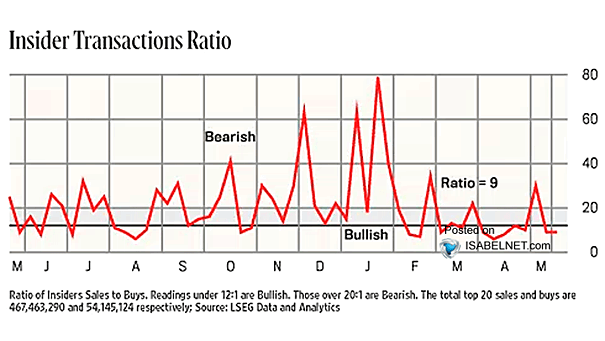
Insider Transactions Ratio A sense of caution prevails among corporate insiders as the Insider Transactions Ratio remains in bearish territory. Image: Barron’s
Insider Transactions Ratio A sense of caution prevails among corporate insiders as the Insider Transactions Ratio remains in bearish territory. Image: Barron’s
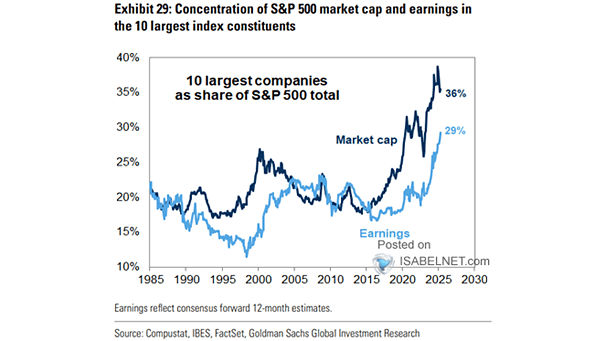
Equity Market Concentration – Market Capitalization of 10 Largest Companies as Share of S&P 500 Total The S&P 500’s top 10 stocks hold a disproportionately large share of the index’s weight relative to their earnings, which amplifies risks tied to volatility, diversification, and sector exposure. Image: Goldman Sachs Global Investment Research

Concentration – Top 10, Top 3 and Top 1 as % of Total (In Terms of Total Equity Market Capitalization) China has one of the lowest market capitalization concentrations worldwide, with its top ten companies comprising only 17% of total market cap—much less than the US’s 34%—indicating greater growth potential in China. Image: Goldman Sachs…
Concentration – Top 10 as % of Total (In Terms of Total Equity Market Capitalization) Compared to the U.S. market, China’s equity market currently shows a historically low level of market capitalization concentration, indicating greater growth potential. Image: Goldman Sachs Global Investment Research
Volatility – U.S. Options Expiration The expiration of $5.9tn in options notional may lead to increased market volatility and price movements, driven by heightened trading activity, shifts in trader sentiment, and the mechanics in option exercise and settlement. Image: Goldman Sachs Global Investment Research
Stock Returns over the Past 33 Presidential Terms Starting on Inauguration Day U.S. stocks, after experiencing a historic drop at the start of the year, have made a strong recovery during Trump’s second term and are now in positive territory for 2025, fueling renewed optimism among bulls. Image: Carson Investment Research
Valuation – U.S. Equities vs. Rest of World – 12-Month Forward PE Ratios U.S. equities trade at historically high valuations versus global peers, with the premium widening. While strong fundamentals support this, it also poses risks if growth expectations decline or macroeconomic conditions worsen. Image: Deutsche Bank
Valuation – S&P 500 Company Actual vs. Modeled FY2 P/E Ratio Valuations for the Magnificent Seven now sit slightly below modeled fair value, especially in light of their robust fundamentals and earnings growth. Image: Goldman Sachs Global Investment Research
S&P 500 Ratio to 1-Year MA vs. S&P 500 EPS S&P 500 market pricing broadly aligns with Deutsche Bank’s Q2 earnings growth forecast. Image: Deutsche Bank Asset Allocation
Valuation – S&P 500 12-Month Forward P/E Ratio The S&P 500’s forward P/E ratio of 20x places it above historical averages, reinforcing the view that current valuations are not historically cheap. Image: The Daily Shot
Forward P/E Ratio and Subsequent 5-Year Annualized Returns Given current U.S. stock market valuations, investors may need to lower their expectations for equity returns over the next five years. Image: J.P. Morgan Asset Management