Global Monetary Policy Map
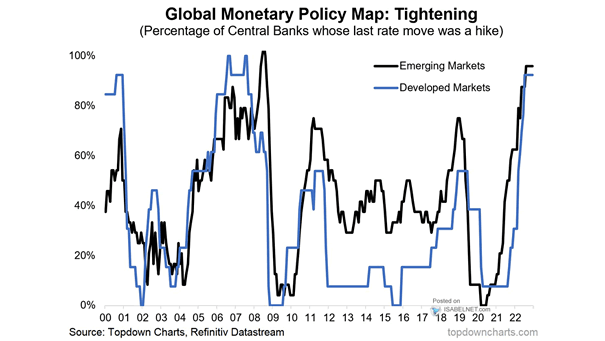
Global Monetary Policy Map So far, global central banks remain firmly in a tightening mode. Image: Topdown Charts
Global Monetary Policy Map So far, global central banks remain firmly in a tightening mode. Image: Topdown Charts
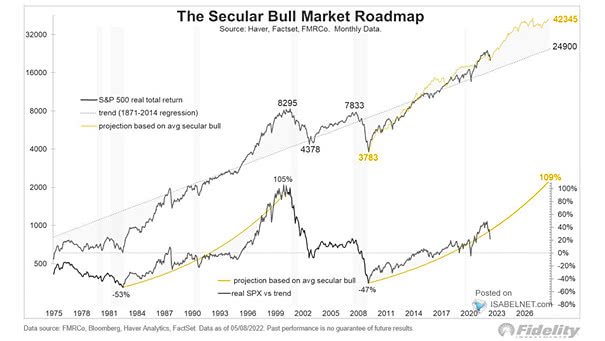
S&P 500 – The Secular Bull Market Roadmap So far, U.S. stocks continue to behave like a secular bull market. Image: Fidelity Investments

Map of the World’s Manufacturing Output The United States is the second world’s largest manufacturer, with $2.3 trillion in output (16.65% of world total in 2018). Image: howmuch.net
Global Valuation Map This chart shows global valuation estimates across various countries, and suggests that the U.S. stock market is overvalued by +4%. Image: Morningstar Research
Sovereign Ratings Map Interesting map of sovereign ratings across the world in July 2019, using Moody’s ratings. Source: Moody’s Sovereign Ratings, Aswath Damodaran
Heat Map of Key Recession Indicators Higher probability of recession than average in red, and lower probability of recession than average in green. Image: BofA Merrill Lynch Global Research
S&P 500 – Secular Roadmaps The chart shows the S&P 500 projection based on average secular bull and the CAPE model. Image: Fidelity Investments
Coronavirus Crisis and Reopening the U.S. Economy This map shows which states are reopening amid the coronavirus pandemic. Image: Bloomberg
Coronavirus – University of Washington Model Predictions for When Different States Will Reopen This map predicts the ideal dates to relax social distancing in the United States. Deutsche Bank Global Research
Global Investment Research Financial Excess Monitor and Recessions The heat map suggests below-average imbalances in the U.S. economy. Image: Goldman Sachs Global Investment Research
VIX and S&P 500 Seasonality The chart shows the seasonality map for the VIX and the S&P 500, and how they move in opposite directions. Image: Topdown Charts