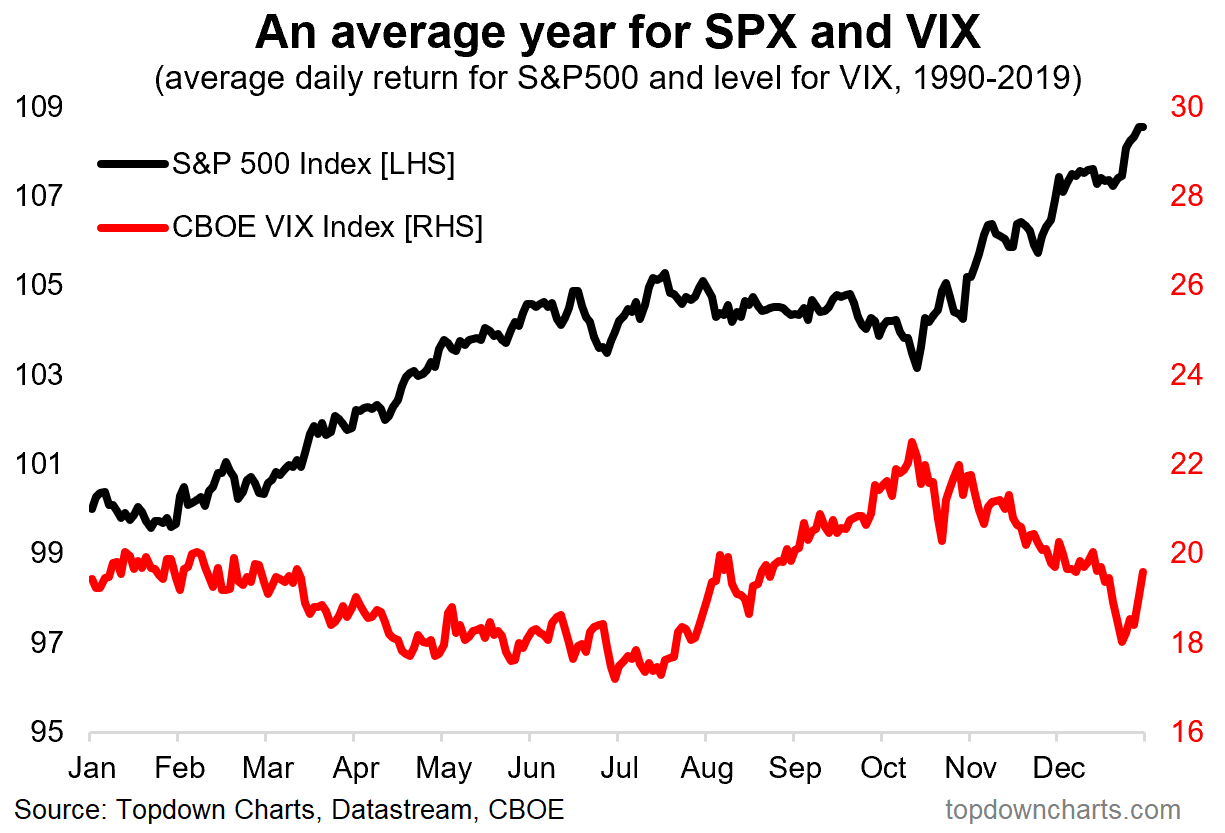
Jun 26 2026 Off VIX and S&P 500 Seasonality The VIX and the S&P 500 usually move in opposite directions. As volatility rises from late July into the autumn months, the period often proves challenging for U.S. stocks.Image: Topdown Charts