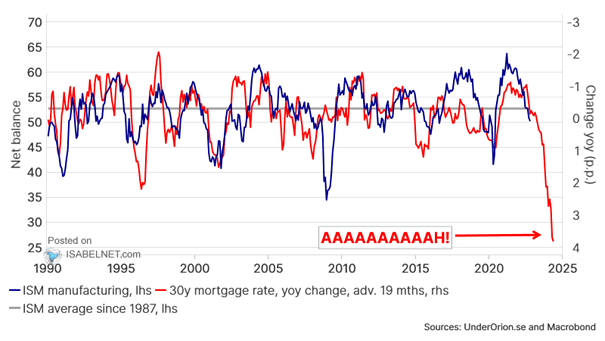
U.S. 30-Year Fixed Mortgage Rates

U.S. 30-Year Fixed Mortgage Rates With Treasury yields rising, are ultra-low mortgage rates over? Image: BofA Global Research

U.S. 30-Year Mortgage Rates vs. 10-Year U.S. Treasury Yield

U.S. 30-Year Mortgage Rates vs. 10-Year U.S. Treasury Yield U.S. 30-year mortgage rates have fallen to record low, but remain elevated relative to the 10-year U.S. Treasury yield. Image: Goldman Sachs Global Investment Research

Housing – U.S. Existing Home Sales and 30-Year Mortgage Rate

Housing – U.S. Existing Home Sales and 30-Year Mortgage Rate This chart shows the correlation between U.S. existing home sales and the 30-year mortgage rate (inverted), and suggests further improvements in sales. Image : Piper Sandler Companies

U.S. Monthly Average 30-Year Fixed Mortgage Rates

U.S. Monthly Average 30-Year Fixed Mortgage Rates Keep in mind that mortgage costs are influenced by the 10-year Treasury yield. 30-year mortgage rates = 1.739 x (10-year treasury yield)² + 0.7755 x (10-year treasury yield) + 0.0227(R² = 0.9787) You may also like “30-Year Mortgage Rates vs. 10-Year Treasury Yield.” Image: Leonard Kiefer

30-Year Mortgage Rates vs. 10-Year Treasury Yield

30-Year Mortgage Rates vs. 10-Year Treasury Yield There is a very high correlation between the 30-year mortgage rates and the 10-year treasury yield 30-year mortgage rates = 1.739 x (10-year treasury yield)² + 0.7755 x (10-year treasury yield) + 0.0227 R² = 0.9787 Image: Calculated Risk