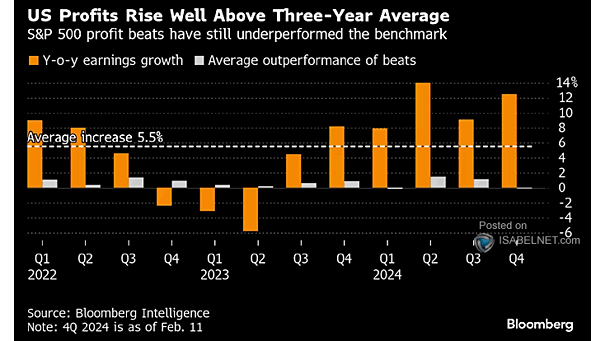
Skip to the content

Advanced Stock Market Forecast for Professional and Individual

Connect with Us on Twitter

isabelnet logo

ISABELNET

Advanced Stock Market Forecast for Professional and Individual

Subscribe
SEARCH  
Menu
  • Home
  • Forecasting Models
    • Stock Market Valuation
    • Stock Market Short-Term Forecast
    • Stock Market Equity Risk Premium
    • Stock Market Bull and Bear Indicator
    • Stock Market Long-Term Forecast
    • Stock Market Forecasting Models vs. US Stock Market
    • 97% Correlation, R² = 0.94 since 1970
    • Recession Indicators
    • Leading Indicators
  • Daily Blog
    • All Recent Posts
      • Daily Blog
    • A
      • AAII Sentiment Survey
      • Active
      • Active Fund
      • Active Investing
      • Activity
      • ACWI
      • Aging
      • Algorithmic Trading
      • All-Time High
      • Allocation
      • America
      • Argentina
      • Asia
      • Asset
      • Asset Class
      • Auto Loan
      • Average Claims
      • Average Return
    • B
      • BA-BL
        • Balance Sheet
        • Baltic Dry Index
        • Bank
        • Bank Reserve
        • Banking
        • Baa
        • BBB
        • Bear
        • Bear Indicator
        • Bear Market
        • Benchmark
        • Berkshire Hathaway
        • Bitcoin
        • Black Swan
      • BO-BU
        • BOE
        • BoJ
        • Bond
        • Bond Market
        • Bond Proxies
        • Bond Yield
        • Breadth
        • Brent
        • Brexit
        • Bubble
        • Budget
        • Budget Deficit
        • Bull
        • Bull and Bear Indicator
        • Bull Indicator
        • Bull Market
        • Bund
        • Business
        • Business Confidence
        • Business Cycle
        • Buyback
    • C
      • CA-CE
        • Calendar
        • Canada
        • Capex
        • Capital
        • Capital Expenditures
        • Capitalization
        • Carbon Emission
        • Cash
        • Cash Flow
        • Cass Freight Index
        • CCC
        • CEO
        • CEO Confidence
        • Central Bank
        • CFO
      • CH-CL
        • Chicago Fed National Activity Index
        • Chicago PMI Index
        • China
        • China Credit
        • China Debt
        • China GDP
        • China Manufacturing PMI
        • China Stock Market
        • Chinese
        • Citi Economic Surprise
        • Claims
        • Climate
      • CN-CON
        • CNY
        • CO2
        • CO2 Emission
        • Commercial Bank
        • Commodities
        • Commodity
        • Companies
        • Compensation
        • Compound
        • Concentration
        • Conference Board
        • Confidence
        • Conflict
        • Consensus
        • Construction
        • Consumer
        • Consumer Confidence
        • Consumer Debt
        • Consumer Expectation
        • Consumer Sentiment
        • Consumer Spending
        • Consumption
      • COP-COS
        • Copper
        • Copper to Gold Ratio
        • Core CPI
        • Core Inflation
        • Core PCE
        • Coronavirus
        • Corporate
        • Corporate Bond
        • Corporate Credit
        • Corporate Debt
        • Corporate Profits
        • Correction
        • Correlation
        • Correlation Matrix
        • Cost
        • Country
      • CP-CY
        • CPI
        • Crash
        • Credit
        • Credit Card
        • Credit Cycle
        • Credit Growth
        • Credit Impulse
        • Credit Spread
        • Crisis
        • Crypto
        • Cryptocurrency
        • Crude Oil
        • Cumulative Flow
        • Currency
        • Cycle
        • Cyclical
    • D
      • Data
      • Debt
      • Debt Ceiling
      • Debt to Equity
      • Debt to GDP
      • Debt Level
      • Defensive
      • Defensive Stock
      • Deficit
      • Deflation
      • Delinquency
      • Democrats
      • Demographics
      • Developed Market
      • Disruption
      • Divergence
      • Diversification
      • Dividend
      • DM
      • Dollar
      • Dow Jones
      • Drawdown
      • Drops
      • Durable
    • E
      • EA-EC
        • Earnings
        • Earnings Estimate
        • Earnings Growth
        • Earnings Revision
        • Earnings Yield
        • EBITDA
        • ECB
        • Economic
        • Economic Cycle
        • Economic Expansion
        • Economic Growth
        • Economic Surprise
        • Economies
        • Economy
      • EL-EQ
        • Election
        • Electric
        • Emerging
        • Emerging Market
        • Empire State Manufacturing Survey
        • Employment
        • Energy
        • EPS
        • EPS Growth
        • EPS Revision
        • Equities
        • Equity
        • Equity Exposure
        • Equity Market
        • Equity Risk Premium
      • ET-EX
        • ETF
        • EUR/USD
        • Euro / US Dollar
        • Euro Area
        • Europe
        • European Equity
        • European Union
        • Eurozone
        • Export
        • Exposure
    • F
      • FA-FE
        • FAANG
        • Fair Valuation
        • Fair Value
        • Fear
        • Fear & Greed Index
        • Fed
        • Fed Funds
        • Fed Insurance Cut
        • Fed Rate
        • Fed Rate Cut
        • Fed Rate Hike
        • Fed Tightening
        • Federal Debt
        • Federal Reserve
        • FedEx
      • FI-FU
        • Financial
        • Financial Conditions
        • Fiscal Policy
        • Fixed Income
        • Flow
        • FOMC
        • Forecast
        • Foreign
        • Foreign Exchange Rate
        • Forex
        • Forward EPS
        • Forward P/E Ratio
        • Free Cash Flow
        • Freight
        • Fund Flow
        • Funds
        • Futures
        • FX
    • G
      • GA-GI
        • G3
        • G7
        • G10
        • Gap
        • GBP
        • GDP
        • GDPNow
        • Generation
        • Geopolitic
        • German
        • Germany
        • Gini Coefficient
      • GLOBAL
        • Global Debt
        • Global Earnings
        • Global Economy
        • Global Employment
        • Global Equity
        • Global Equities
        • Global EPS
        • Global Flow
        • Global GDP
        • Global Growth
        • Global Inflation
        • Global M1
        • Global Manufacturing
        • Global Manufacturing PMI
        • Global Market
        • Global Monetary Policy
        • Global Money Supply
        • Global PMI
        • Global Recession
        • Global Sales
        • Global Stock Market
        • Global Trade
        • Globalization
      • GO-GR
        • Gold
        • Gold Ratio
        • Gold Reserve
        • Goods
        • Government
        • Government Bond
        • Government Debt
        • Greece
        • Gross Margin
        • Growth
        • Growth Stock
    • H
      • Hard Data
      • Health
      • Health Care
      • Heavy Truck Sales
      • Hedge
      • Hedge Fund
      • Hedge Fund Exposure
      • High Yield
      • Historical
      • Home
      • Home Price
      • Home Sales
      • House
      • Household
      • Household Debt
      • Housing
      • Housing Bubble
    • I
      • IF-INS
        • IFO
        • IG Bond
        • Immigrant
        • Import
        • Income
        • India
        • Indicator
        • Industrial
        • Industrial Production
        • Industry
        • Inequality
        • Inflation
        • Inflow
        • Insider
        • Insurance Cut
      • INT-ISM
        • Interest Rate
        • Intrinsic Value
        • Investment
        • Investment Grade
        • Investor
        • Investor Sentiment
        • IPO
        • ISM
        • ISM Composite Index
        • ISM Composite PMI
        • ISM Manufacturing Index
        • ISM Non-Manufacturing Index
    • J
      • Japan
      • Japan Corporate Profits
      • Job
      • Job Growth
      • Job Openings
      • Jobless Claims
      • Junk Bonds
    • K
      • KC Fed Labor Market Conditions Index
      • Korea
    • L
      • Labor
      • Labor Force
      • Labor Market
      • Large Cap
      • Leading Economic Index
      • Leading Indicators
      • LEI
      • Leverage
      • Leveraged Loan
      • Liquidity
      • Listed Companies
      • Loan
      • Long-Term Trend
      • Low Volatility
      • Lumber
    • M
      • M1-MA
        • M1
        • M2
        • M2 Velocity
        • M&A
        • Madness
        • Manufacturing
        • Manufacturing PMI
        • Map
        • Margin
        • Margin Debt
        • Market
        • Market Capitalization
        • Market Cycle
        • Market Performance
        • Market Return
        • Market Sentiment
        • Market Share
        • Market Valuation
        • Maturity
      • MI-MOR
        • Millionaire
        • Misery Index
        • Momentum
        • Monetary Policy
        • Money Supply
        • Money
        • Money Market
        • Monthly Return
        • Mortgage
        • Mortgage Rate
      • MOV-MU
        • MOVE
        • Moving Average
        • MSCI
        • MSCI ACWI
        • MSCI All Country World Index
        • MSCI Europe
        • MSCI World
        • MSCI World Growth
        • MSCI World Value
        • Multiple
        • Multiple Expansion
        • Mutual Fund
    • N
      • NAAIM
      • NAHB
      • Nasdaq
      • National Debt
      • NBER
      • Negative Rate
      • Negative Yield
      • New High
      • New Home Sales
      • NFIB
      • Nikkei
      • NIPA Profits
      • Non-Manufacturing
      • Nonfarm Payroll
    • O
      • OECD
      • OECD Composite Leading Indicator
      • Oil
      • Oil Market
      • Oil Price
      • Oil Share
      • OPEC
      • Operating Earnings
      • Outbreak
      • Outflow
      • Outlook
      • Outperformance
      • Output Gap
      • Overvaluation
      • Overvalue
    • P
      • PA-PH
        • Passive
        • Passive Fund
        • Passive Investing
        • Payout Ratio
        • Payroll
        • PCE
        • P/E Ratio
        • Performance
        • Personal Consumption Expenditure
        • Philadelphia Semiconductor Index
        • Philly Fed
      • PM-PREM
        • PMI
        • Policy
        • Policy Easing
        • Policy Rate
        • Policy Uncertainty
        • Population
        • Portfolio
        • Prediction
        • Premium
      • PRES-PU
        • President
        • Presidential
        • Presidential Election
        • Price
        • Price Target
        • Private Debt
        • Private Equity
        • Probability
        • Productivity
        • Projection
        • Profit
        • Profit Margin
        • Potential GDP
        • Pullback
    • Q
      • Quant
      • Quantitative Easing
      • Quantitative Tightening
      • Quote
    • R
      • RA-REA
        • R-squared
        • R-Star
        • R&D
        • Rallies
        • Rally
        • Ranking
        • Rate Cut
        • Rate Hike
        • Rates
        • Rating
        • Ratio
        • Real Estate
        • Real GDP
        • Real Yield
      • REA-RET
        • Recession
        • Record High
        • Recovery
        • Reflation
        • Region
        • Repo Market
        • Republicans
        • Repurchase
        • Reserve
        • Retail
        • Retail Sales
        • Return
      • REV-RU
        • Revenue
        • Revision
        • Richmond Fed Survey
        • Risk
        • Risk Appetite
        • Risk Parity
        • Risk Premium
        • Rotation
        • Russell
        • Russia
    • S
      • S&P 500 AL-GA
        • S&P 500
        • S&P 500 All-Time High
        • S&P 500 Bear Market
        • S&P 500 Bull Market
        • S&P 500 Buyback
        • S&P 500 Cycle
        • S&P 500 Dividend
        • S&P 500 Drawdown
        • S&P 500 Earnings
        • S&P 500 Election
        • S&P 500 EPS
        • S&P 500 ETF
        • S&P 500 Gain
      • S&P 500 FO-VO
        • S&P 500 Forecast
        • S&P 500 Future
        • S&P 500 Performance
        • S&P 500 Price
        • S&P 500 Projection
        • S&P 500 Pullback
        • S&P 500 Return
        • S&P 500 Seasonal
        • S&P 500 Short Interest
        • S&P 500 Stock
        • S&P 500 Valuation
        • S&P 500 Volatility
      • SA-SE
        • Sales
        • Saudi Arabia
        • Saving
        • Seasonal
        • Secular
        • Secular Bull Market
        • Securities
        • Sell in May
        • Semiconductor
        • Sentiment
        • Service
      • SH-SM
        • Shale
        • Share Buybacks
        • Shareholder
        • Sharpe Ratio
        • Short Interest
        • Silver
        • Singapore
        • Slope
        • Small Business
        • Small Cap
      • SO-STOC
        • Soft Data
        • South Korea
        • South Korea Export
        • Sovereign
        • Spending
        • Spread
        • Stock Buybacks
        • Stock Market
        • Stocks
      • STOO-SW
        • Stoxx 600
        • Strategy
        • Student Loan
        • Surprise
        • Survey
        • Swan
    • T
      • TA-TI
        • T-Bill
        • Taiwan
        • Target
        • Tariff
        • Tax
        • Tech
        • Term Premium
        • Term Structure
        • Tightening
        • TIPS
      • TRA
        • Trade
        • Trade Balance
        • Trade Conflict
        • Trade Deal
        • Trade Tension
        • Trade War
        • Trading
      • TRE-TW
        • Treasuries
        • Treasury
        • Treasury Holdings
        • Trend
        • Truck
        • Truck Tonnage
        • Trump
        • Twin Deficits
    • U
      • UN
        • Unemployment
        • Unemployment Rate
        • Uncertainty
        • Unicorn
        • United States
        • University of Michigan Consumer Sentiment Index
      • US-UT
        • U.S.
        • U.S. Debt
        • U.S. Dollar
        • U.S. Economy
        • U.S. GDP
        • U.S. PMI
        • USA
        • USD
        • USD/CNY
        • Utilities
        • Utility
    • V
      • Valuation
      • Value
      • Value Stock
      • Velocity
      • Venezuela
      • Virus
      • VIX
      • VIX Term Structure
      • Volatility
      • Volume
    • W
      • WA-WE
        • Wage
        • Wage Growth
        • Wall of Worry
        • Wealth
        • Wealth Inequality
      • WORLD
        • World
        • World Debt
        • World Economy
        • World Equities
        • World EPS
        • World GDP
        • World Growth
        • World Trade
      • WT
        • WTI
    • Y
      • YouTube
        • > All Interviews
        • Charlie Munger
        • Howard Marks
        • Jeffrey Gundlach
        • Ken Fisher
        • Ray Dalio
        • Thomas Russo
        • Warren Buffett
      • Yen
      • Yield
      • Yield Curve
      • Yield Curve Inversion
      • Yield Spread
      • Yuan
    • Z
      • Zombie Companies
    • 2-30
      • 2
        • 2-Year
        • 2-Year Yield
        • 200D
        • 200MA
        • 2s-10s
      • 5
        • 5-Year
        • 5-Year Yield
      • 10
        • 10-Year
        • 10-Year Yield
        • 10Y-2Y
        • 10Y-3M
      • 30
        • 30-Year
        • 30-Year Yield
        • 30Y-10Y
  • Log In
    • Basic Membership
    • Premium Membership
    • Pro Membership
    • Retrieve Your Password
    • Renew Your Visa/MasterCard
    • Log Out
  • Contact
  • FAQ
  • About

Search Results for: outperformance


Monthly Outperformance of NYFANG Over ACWI and ECB QE Total
Jan 08 2022

Monthly Outperformance of NYFANG Over ACWI and ECB QE Total

Monthly Outperformance of NYFANG Over ACWI and ECB QE Total Is the shock of central bank tightening in Europe and Japan the most underappreciated risk this year? Image: BofA Global Investment Strategy

Hit Rate of Outperformance vs. S&P 500 and Average Alpha of High Beta Stocks
Nov 05 2021

Hit Rate of Outperformance vs. S&P 500 and Average Alpha of High Beta Stocks

Hit Rate of Outperformance vs. S&P 500 and Average Alpha of High Beta Stocks Historically, November tends to be a good month for high beta stocks. Image: BofA US Equity & Quant Strategy

Buyback Basket Monthly Hit Rate of Outperformance vs. S&P 500
Aug 17 2021

Buyback Basket Monthly Hit Rate of Outperformance vs. S&P 500

Buyback Basket Monthly Hit Rate of Outperformance vs. S&P 500 Buyback stocks tend to outperform the S&P 500. Image: Goldman Sachs Global Investment Research

Cycles of U.S. Equity Outperformance - MSCI EAFE and MSCI USA Relative Performance
Jul 09 2021

Cycles of U.S. Equity Outperformance – MSCI EAFE and MSCI USA Relative Performance

Cycles of U.S. Equity Outperformance – MSCI EAFE and MSCI USA Relative Performance Will U.S. stocks continue to outperform developed market equities (ex-US)? Image: J.P. Morgan Asset Management

S&P 500's Outperformance Over U.S. Treasuries
Apr 05 2021

Performance – S&P 500’s Outperformance Over U.S. Treasuries

Performance – S&P 500’s Outperformance Over U.S. Treasuries Will the S&P 500’s outperformance over U.S. Treasuries continue? Image: Arbor Research & Trading LLC

Outperformance of Procyclical Styles - Current Rotation vs. History
Feb 24 2021

Outperformance of Procyclical Styles – Current Rotation vs. History

Outperformance of Procyclical Styles – Current Rotation vs. History Investors are pricing a cyclical recovery. Image: Morgan Stanley Research

Nasdaq Outperformance Over S&P 500
Sep 29 2020

Nasdaq Outperformance Over S&P 500

Nasdaq Outperformance Over S&P 500 Will the Nasdaq continue to outperform the S&P 500? Image: Morgan Stanley Wealth Management

% of Tech Outperformance Explained by Bond Yields
Aug 27 2020

% of Tech Outperformance Explained by Bond Yields

% of Tech Outperformance Explained by Bond Yields Chart suggesting that falling bond yields lead to tech outperformance more than ever. Image: BofA Research Investment Committee

Stocks, Bonds, Foreign Exchange and Commodities Outperformance
Dec 17 2019

Stocks, Bonds, Foreign Exchange and Commodities Outperformance

Stocks, Bonds, Foreign Exchange and Commodities Outperformance Stocks, bonds, FX and commodities outperformed in 2019. Image: Deutsche Bank Global Research

Outperformance of the Biggest Companies vs. Rest of the Market
Dec 10 2019

Outperformance of the Biggest 10% Companies vs. Rest of the Market

Outperformance of the Biggest 10% Companies vs. Rest of the Market Chart showing that the biggest 10% of companies have significantly outperformed the rest of the market. Image: Societe Generale Cross Asset Research

Posts navigation

1 2 … 5 Next

RECENT POSTS

Different Market Sentiment Indicators

Different Market Sentiment Indicators

07/06/2022 Off
Cyclical/Defensive Equities Ratio vs. 10-Year Treasury Yield

Cyclical/Defensive Equities Ratio vs. 10-Year Treasury Yield

07/06/2022 Off
S&P 500 and Manufacturing PMI

S&P 500 and Manufacturing PMI

07/06/2022 Off
S&P 500 Total Return Index (Real Annual Returns)

S&P 500 Total Return Index (Real Annual Returns)

07/06/2022 Off
ISM Manufacturing PMI vs. Cyclicals-Defensives Ratio

ISM Manufacturing PMI vs. Cyclicals/Defensives Ratio

07/06/2022 Off

Forecasting Models

  • Stock Market Valuation
  • Stock Market Short-Term Forecast
  • Stock Market Equity Risk Premium
  • Stock Market Bull and Bear Indicator
  • Stock Market Long-Term Forecast
  • Forecasting Models vs. Stock Market
  • 97% Correlation, R² = 0.94 since 1970
  • Recession Indicators
  • Leading Indicators

Daily Blog

  • Daily Blog Posts

About

  • About Isabelnet
  • FAQ
  • Contact
  • Home

Membership

  • Subscribe
  • Basic Membership
  • Premium Membership
  • Pro Membership
  • Retrieve your Password
  • Renew your Visa/MasterCard
  • Log Out

Legal

  • Terms of Use
  • Privacy Policy
  • Legal Notice

Follow Us

Icon Small

© 1998-2022 ISABELNET S.A.

The opinion expressed on this website is for informational & educational purposes only and is not intended as advice to buy or sell securities

The forecasts set forth may not develop as predicted. Past performance is no guarantee, nor is it indicative, of future results

Custom Search

This website uses cookies to improve your experience. We'll assume you're ok with this, but you can opt-out if you wish. Accept Settings Read More
Privacy & Cookies Policy

Privacy Overview

This website uses cookies to improve your experience while you navigate through the website. Out of these cookies, the cookies that are categorized as necessary are stored on your browser as they are essential for the working of basic functionalities of the website. We also use third-party cookies that help us analyze and understand how you use this website. These cookies will be stored in your browser only with your consent. You also have the option to opt-out of these cookies. But opting out of some of these cookies may have an effect on your browsing experience.
Necessary
Always Enabled
Necessary cookies are absolutely essential for the website to function properly. This category only includes cookies that ensures basic functionalities and security features of the website. These cookies do not store any personal information.
Non-necessary
Any cookies that may not be particularly necessary for the website to function and is used specifically to collect user personal data via analytics, ads, other embedded contents are termed as non-necessary cookies. It is mandatory to procure user consent prior to running these cookies on your website.
SAVE & ACCEPT