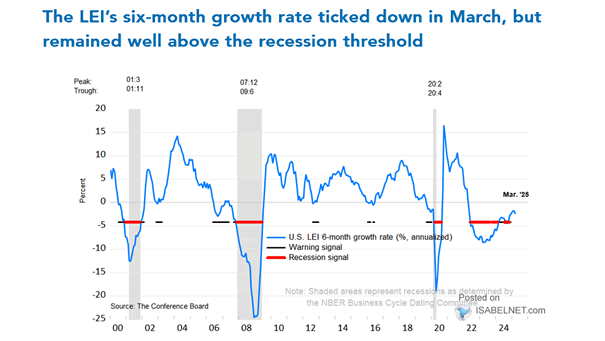
The Conference Board Leading Economic Index (LEI) for the U.S.
The Conference Board Leading Economic Index (LEI) for the U.S. The U.S. LEI decreased by 0.4% in August, suggesting weaker economic activity ahead. Image: The Conference Board
S&P 500 Average Negative Sentiment Score YoY vs. Quarterly EPS YoY (Leading Indicator) The significant increase in corporate sentiment indicates a potential recovery in earnings, which is good news. Image: BofA Global Research
Copper to Gold Ratio and U.S. 10-Year Treasury Yield (Leading Indicator) The 10-year U.S. Treasury yield has not supported the copper/gold ratio. Image: Morgan Stanley Research
Inflation – CPI Services vs. PPI Services and ISM Non-Manufacturing Prices Paid (Leading Indicator) The ISM Non-Manufacturing Prices Paid and PPI services tend to lead CPI services by 9 months. Image: Alpine Macro
U.S. Dollar Index vs. 10Y-3M Real U.S. Treasury Yield Curve (Leading Indicator) The real U.S. yield curve suggests that the U.S. dollar may weaken over the next 12 months. Image: Morgan Stanley Wealth Management
WTI Oil Price vs. CPI Inflation (Leading Indicator) Oil prices tend to lead U.S. CPI inflation by 6 months. Image: Alpine Macro
Russell 2000 / S&P 500 vs. ISM Manufacturing PMI (Leading Indicator) The performance of U.S. small caps relative to the S&P 500 suggests a decline in the ISM Manufacturing PMI. Image: Morgan Stanley Research
M2 Annual % ROC (Advanced 12-Months) vs. GAAP Earnings (Leading Indicator) The significant decline in M2 growth puts GAAP earnings at risk. Image: Real Investment Advice
Recession – U.S. Conference Board Leading Index (LEI) Does the current decline in the U.S. Leading Economic Index (LEI) guarantee a recession within the next few months? Image: Deutsche Bank
Relative Performance of Prior Bull Market Leader vs. The Next Bull Market Leader Should investors continue to overweight the energy sector over the tech sector? Image: BofA US Equity & Quant Strategy