S&P 500 Valuation Multiples

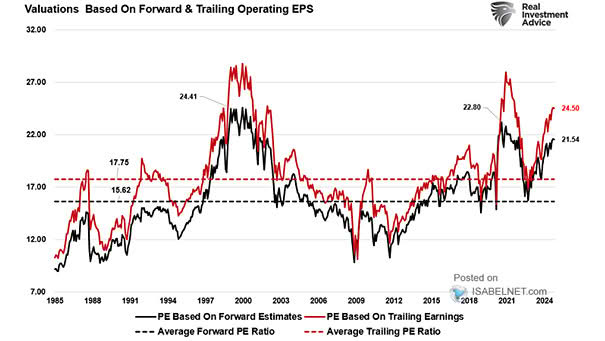
S&P 500 Valuation Multiples Overvaluation in the S&P 500, especially among tech and AI stocks, is a legitimate concern in light of downward revisions to earnings estimates for 2025 and the high degree of index concentration. Image: Real Investment Advice
S&P 500 Valuation

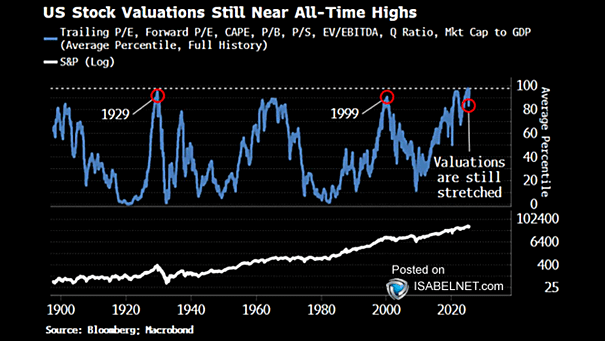
S&P 500 Valuation The S&P 500 remains significantly overvalued according to several long-term valuation metrics. Historically, such elevated valuations have often preceded periods of below-average long-term equity returns. Image: Bloomberg

U.S. Consumer Confidence Composite vs. Trailing S&P 500 Valuations

U.S. Consumer Confidence Composite vs. Trailing S&P 500 Valuations The composite consumer confidence index is highly correlated with trailing one-year S&P 500 valuations, which can signal times of market exuberance or caution. Image: Real Investment Advice

S&P 500 Valuations

S&P 500 Valuations The composite S&P 500 valuation indicator—which integrates PE ratios, equity risk premia, and price-based mean reversion factors—has recently reset to a level close to neutral, which is an encouraging sign. Image: Topdown Charts

S&P 500 Valuations Based On Forward Operating EPS

S&P 500 Valuations Based On Forward Operating EPS The sharp market sell-off has triggered a reversion in S&P 500 valuations, which have dropped from 22.5x to 18.5x forward earnings over the past month. With the long-term average near 16x, there may still be scope for further declines. Image: Real Investment Advice

S&P 500 Valuations

S&P 500 Valuations Valuations don’t matter—until they do. Prolonged periods of high valuations can lead to lower future returns, so investors should approach them with caution. Image: Topdown Charts

S&P 500 Valuations

S&P 500 Valuations Despite recent declines, U.S. stocks are still expensive when compared to historical standards, raising concerns about future returns amid economic uncertainty. Image: BCA Research

U.S. Household Equity Ownership vs. S&P 500 Valuations

U.S. Household Equity Ownership vs. S&P 500 Valuations Despite positive economic indicators and strong investor sentiment supporting the current market, the high levels of household equity allocation present risks that could trigger corrections and impact long-term returns. Image: Real Investment Advice

S&P 500 Valuation vs. History

S&P 500 Valuation vs. History Compared to historical standards, most S&P 500 sector P/E valuations are elevated, raising concerns about potential market overvaluation. Image: Goldman Sachs Global Investment Research

S&P 500 Valuation – Shiller P/E Ratio at the Start of Presidency

S&P 500 Valuation – Shiller’s Cyclically-Adjusted Price-To-Earnings (CAPE) Ratio With the Shiller P/E ratio indicating an unusually high valuation for the U.S. stock market compared to the start of previous presidential terms, investors may need to moderate their expectations for future returns. Image: The Wall Street Journal

S&P 500 Valuation Metrics

S&P 500 Valuation Metrics While the current forward P/E ratio of 21.6x for the S&P 500 is high by historical standards, it has moderated somewhat from its recent highs. Image: Goldman Sachs Global Investment Research