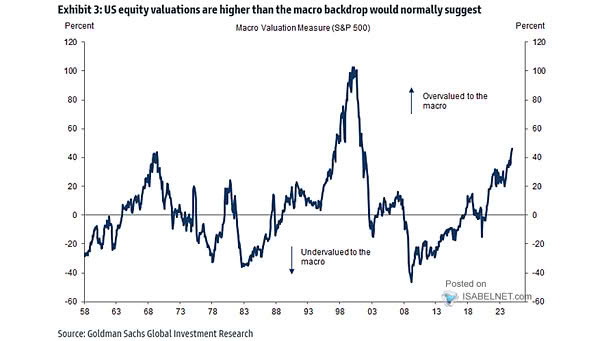
S&P 500 Valuation vs. History

S&P 500 Valuation vs. History S&P 500 valuation metrics remain elevated by historical standards. Image: Goldman Sachs Global Investment Research

Estimated S&P 500 Valuation Depending on Election Outcome

Estimated S&P 500 Valuation Depending on Election Outcome According to Goldman Sachs, a Democratic sweep could lift the S&P 500 Index to 3400 in the near-term, and to 3800 in mid-2021. Image: Goldman Sachs Global Investment Research

S&P 500 Valuation Dispersion on Forward P/E

S&P 500 Valuation Dispersion on Forward P/E When valuation dispersion was this high, value stocks tended to outperform growth stocks. Image: BofA US Equity & Quant Strategy

S&P 500 Valuation – Consensus FY2 P/B and Return on Equity (ROE)

S&P 500 Valuation – Consensus FY2 PB and Return on Equity (ROE) This chart suggests that the current valuation of the S&P 500 appears broadly consistent with the correlation between consensus FY2 P/B and return on equity (R² = 0.42). Image: Goldman Sachs Global Investment Research

S&P 500 Valuation Multiples

S&P 500 Valuation Multiples The price-to-sales ratio of the S&P 500 Index suggests that stocks are as expensive as they were during the Internet bubble. The P/E ratio also remains at high level. Image: Tomasz Hońdo

S&P 500 Valuation Metric

S&P 500 Valuation Metric Is the U.S. equity market overvalued? The S&P 500’s median valuation metric is in the 89th percentile. That’s not cheap by historical standards. Image: Goldman Sachs Global Investment Research