S&P 500 Index Market Capitalization, YTD Performance
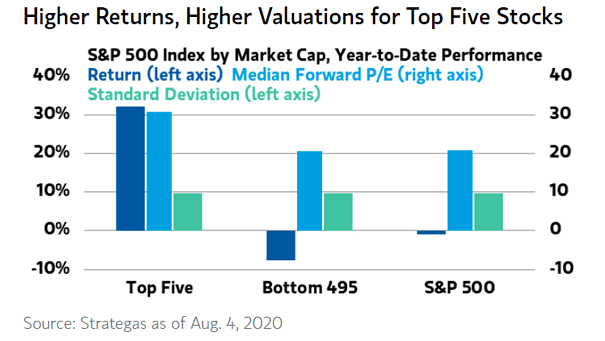
S&P 500 Index Market Capitalization, YTD Performance Higher returns YTD, but higher valuations for the top five stocks. Image: Morgan Stanley Wealth Management
S&P 500 Index Market Capitalization, YTD Performance Higher returns YTD, but higher valuations for the top five stocks. Image: Morgan Stanley Wealth Management
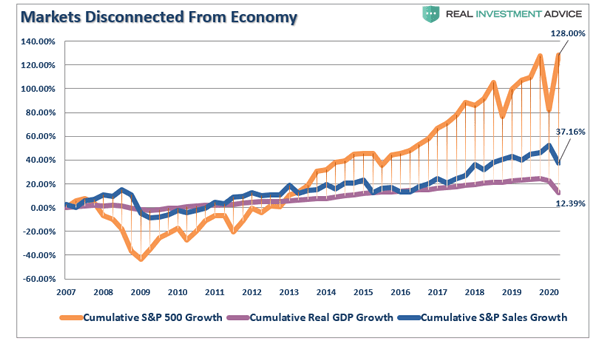
S&P 500 Growth vs. U.S. Real GDP Growth vs. S&P 500 Sales Growth Do valuations still matter? This chart puts into perspective the wide divergence between the S&P 500 and the U.S. economy. Image: Real Investment Advice

Net Investor U.S. Equity Futures Positions vs. Robinhood Distinct User Positions in S&P 500 Stocks Is this going to end well? Goldman Sachs is starting to worry about valuation. Image: Goldman Sachs Global Investment Research
S&P 500 vs. Profit Margins Do valuations still matter? The current divergence between the S&P 500 and profit margins is huge. Image: Crescat Capital LLC
Bank Reserves and S&P 500 J.P. Morgan suggests that Fed-injected liquidity is not the reason for the rise in the valuation of risk assets. Image: J.P. Morgan
S&P 500 RSI With the S&P 500’s RSI running high, caution is warranted. Market participants should be ready for a potential pullback or a period of consolidation as the market digests overbought levels before pushing higher again. Image: J.P. Morgan
S&P 500 PE Level vs. Average 12-month Return The chart shows how market valuation affects future equity returns since 1930. You may also like “Why the Stock Market Valuation Matters Before a Recession?“ Image: Richardson Wealth
Six months ago, the S&P 500 was overvalued by more than 14%… Six months ago, the S&P 500 was overvalued by more than 14% before the market crash, through our advanced stock market valuation model. Near the same level today and within 1% of a record high, the US stock market remains slightly overvalued by 7.8%.…