U.S. Market Cycle Indicators
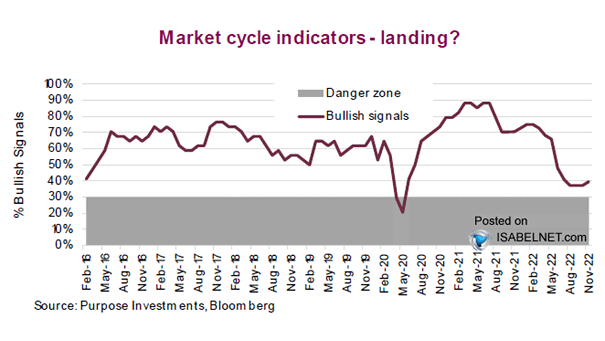
U.S. Market Cycle Indicators Will the % of market cycle indicators be less than 30% in the next 12 months? Image: Richardson Wealth
U.S. Market Cycle Indicators Will the % of market cycle indicators be less than 30% in the next 12 months? Image: Richardson Wealth
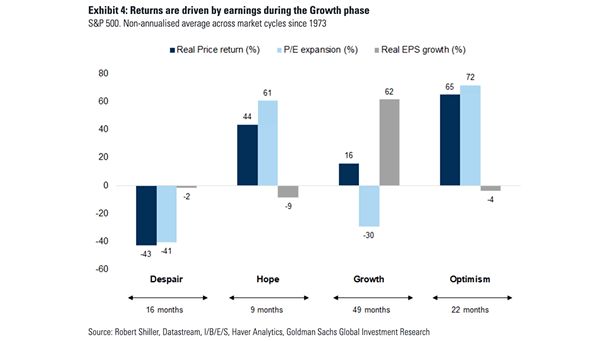
S&P 500 Average Across Market Cycles Since 1973 This chart puts into perspective the typical phases of the U.S. equity market since 1973. Image: Goldman Sachs Global Investment Research

IPO Activity and Market Cycle IPO activity tends to be slow in the early phases of a new bull market, but that’s not the case today. Image: Richardson Wealth
S&P 500 Total Return – The Market Cycle Since the March low, the U.S. stock market continues to behave like a secular bull market. Image: Fidelity Investments
Market Cycle Back Tested over the Years Chart suggesting that the end of a bull market often occurs when the percentage signals that are bullish fall to 30% or below. Image: Richardson Wealth
Cumulative Mutual Fund + ETF Flows by Bull Market Cycle: Bonds vs. Equities Flows Is this the most hated bull market in history? Well, investors continue buying bonds. Image: ICI Mutual & ETF Flow
Leon Cooperman: Bull Market Cycles Don’t End at Fair Valuation, They Ended at Overvaluation “There is still more room for the market to run. We have a slowdown but not a recession and the market is ok.” Leon Cooperman (Omega Advisors founder) is a great value investor. https://www.youtube.com/watch?v=Xz6ihkuW1AM
‘We are entering into the later market cycle,’ says portfolio manager Mike Morey, CIO of Integrity Viking Funds, says why investors should be more risk averse at this point of the cycle. https://www.youtube.com/watch?v=g_vVdwtu6SM
A Conversation with Howard Marks: Mastering the Market Cycle Legendary investor Howard Marks speaks about market cycles and how to profit from them. https://www.youtube.com/watch?v=Xbs5e5pcVYI
Howard Marks: Pattern Recognition In Markets, Portfolio Positioning and Market Cycles (2018) Howard Marks speaks at UCLA Anderson School of Management with Alfred E. Osborne about cyclical indicators and historic market patterns to find opportunities. https://www.youtube.com/watch?v=6ATUoZ6qjpI
S&P 500 – Seasonality During Bull vs. Bear Markets – 3rd Year of U.S. Election Cycle Only Both bulls and bears may be frustrated this year. Image: Topdown Charts