Market Depth on 10-Year USTs and 10-Year Bund Futures
Market Depth on 10-Year USTs and 10-Year Bund Futures Will market depth on 10Y USTs and 10Y Bund futures continue to improve? Image: J.P. Morgan
Stocks – MSCI EMU Earnings Yield Minus Real 10-Year Bund Yield (Equity Risk Premium) The equity risk premium below its 10-year average does not bode well for eurozone stocks. Image: Gavekal, Macrobond
Euro to U.S. Dollar (EUR/USD) and 10-Year Bund/UST EUR/USD looks expensive vs. real 10-year rate differentials. Image: Societe Generale Cross Asset Research
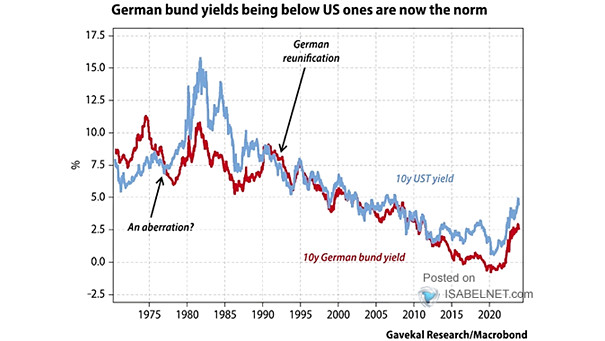
U.S. 10-Year Treasury Yield vs. 10-Year Bund Yield The gap between U.S. and European interest rates is widening. Image: BofA
Germany – Explaining 10-Year Bund Yields This great chart suggests that demographics explain Germany’s 10-year bund yields. An R² of 0.87 is quite high and significant. Image: Arbor Research & Trading LLC
10-Year German Bund Yield and German Manufacturing PMI The 10-year German Bund yield could go positive again as recession fears dissipate. Image: Pictet Wealth Management
European Equities Lead Bund Yields by 6 Months Because European equities tend to lead bund yields by 6 months, bund yields should turn higher. Image: Reuters