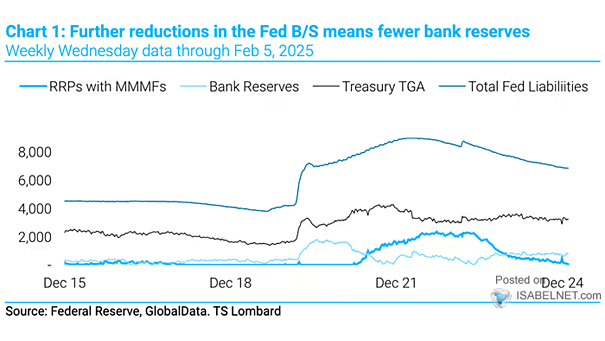
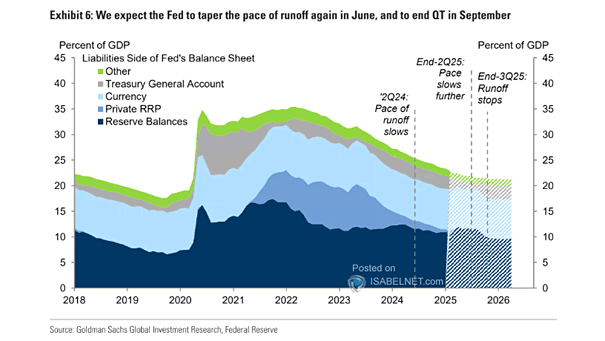
Fed Balance Sheet % of GDP
Fed Balance Sheet % of GDP Will the Fed start reducing its balance sheet in May? Image: BofA Global Research
Fed Balance Sheet vs. S&P 500 Should U.S. equity investors be worried if the Fed reduces its balance sheet to combat inflation? Image: Real Investment Advice
S&P 500 Performance Through Different Fed Balance Sheet Regimes U.S. equity investors should not worry too much about the Fed’s balance sheet reduction. Image: J.P. Morgan Equity Macro Research
Fed Balance Sheet Size Will the Fed start reducing its balance sheet this year? Image: Goldman Sachs Global Investment Research
Returns – Modelled S&P 500 Based on Change in Forward EPS and YoY Change in Fed Balance Sheet vs. Actual S&P 500 Should investors expect anemic S&P 500 returns through 2024? Image: BofA US Equity & Quant Strategy
S&P 500 – Fed Balance Sheet vs. Equity Price Returns Could the Fed’s balance sheet reduction derail the U.S. stock market? Image: Alpine Macro
Post-GFC Fed Balance Sheet Phases, Fed Funds, UST 10-Year and the S&P 500 Can U.S. stocks survive the Fed’s tapering and rate hikes? Image: Deutsche Bank
Fed Funds and Balance Sheet Contraction vs. S&P 500 How will the S&P 500 perform in 2022 with the Fed’s policy changes? Image: Real Investment Advice
Cumulative Growth of Fed Balance Sheet and S&P 500 Index Cumulative Growth The large expansion of the Fed’s balance sheet tends to push the S&P 500 Index higher (R² = 0.829 since 2009). Image: Real Investment Advice
Expensive Stocks and Fed Balance Sheet Are expensive stocks vulnerable to Fed tapering in 2022? Image: Morgan Stanley Research