Trade Weighted Dollar vs. U.S. Inflation Surprises

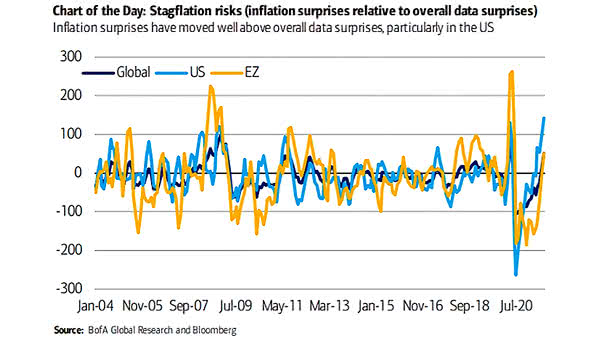
Trade Weighted Dollar vs. U.S. Inflation Surprises Since February 2025, the U.S. dollar has closely tracked inflation surprises, as both headline and core inflation came in lower than expected, reflecting Fed policy expectations and concerns about the U.S. economic outlook. Image: Societe Generale Cross Asset Research
Federal Reserve Broad Real Effective Trade-Weighted Dollar

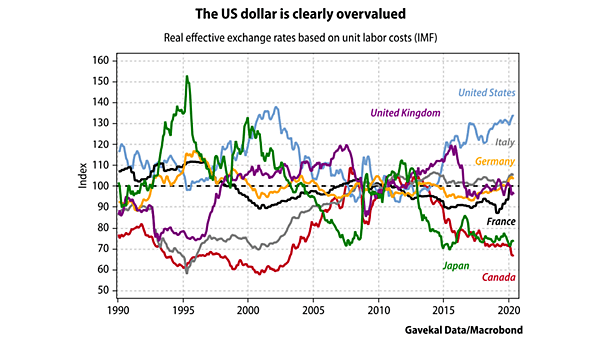
Federal Reserve Broad Real Effective Trade-Weighted Dollar Both historical trends and current economic indicators suggest that the U.S. dollar is entering a period of decline. Structural fiscal challenges, policy uncertainty, and cyclical patterns all point to further weakness ahead. Image: Bloomberg

Performance – S&P 500 vs. 30-Year US Treasury vs. Trade-Weighted U.S. Dollar

Performance – S&P 500 vs. 30-Year US Treasury vs. Trade-Weighted U.S. Dollar The simultaneous decline of U.S. equities, bonds, and the dollar is rare—especially during periods of market stress— and signals a potential shift in global investor sentiment and the structural underpinnings of U.S. financial markets. Image: Goldman Sachs Global Investment Research

U.S. vs. Non-U.S. Equity and U.S. vs. Europe Equity and Real Trade-Weighted US Dollar Index

U.S. vs. Non-U.S. Equity and U.S. vs. Europe Equity and Real Trade-Weighted US Dollar Index The start of 2025 marks a significant pause-and possible reversal-in U.S. equity exceptionalism. Whether this is a temporary pause or a fundamental shift remains to be seen, but the landscape for global investors has changed. Image: Goldman Sachs Global Investment…

Aggregate U.S. Dollar Position, Non-Commercial Traders

Aggregate U.S. Dollar Position, Non-Commercial Traders Speculators are holding their most bearish positions on the U.S. dollar since September 2024, driven by global optimism, de-dollarization trends, and relative strength in other major currencies. Image: Bloomberg

Trade Policy Uncertainty

Trade Policy Uncertainty When trade policy uncertainty peaks, the S&P 500 often posts positive returns. Markets tend to over-discount risks during uncertain periods, and relief rallies are common once worst-case scenarios are avoided or resolved. Image: Goldman Sachs Global Investment Research

Notional Volume Traded in Listed U.S. Equity Options

Notional Volume Traded in Listed U.S. Equity Options Thanks to strong participation from both retail and institutional investors, U.S. equity options are seeing rising average daily trading volumes—a trend that shows no signs of slowing down. Image: Goldman Sachs Global Investment Research

Trade Policy Uncertainty Indexes

Trade Policy Uncertainty Indexes Uncertainty in trade policy often leads to positive future returns for the S&P 500, as markets tend to price in worst-case scenarios during unclear times. Once clarity emerges, stocks frequently recover. Image: Deutsche Bank

U.S. Broad Trade-Weighted Dollar Index

U.S. Broad Trade-Weighted Dollar Index The U.S. dollar’s continued rise in Q4 2024 will likely remain a modest headwind to earnings growth, as it was in the previous two quarters. Image: Deutsche Bank Asset Allocation

What Do You Think Is Currently the Most Crowded Trade?

What Do You Think Is Currently the Most Crowded Trade? For FMS investors, the “Long Magnificent Seven” trade continues to be the most crowded, largely attributed to the impressive performance and market leadership of these tech stocks. Image: BofA Global Fund Manager Survey

G10 FX Carry Trade Index

G10 FX Carry Trade Index The Bank of Japan’s recent actions caused market turmoil termed an “ugly deleveraging event,” reflecting ongoing economic challenges in Japan. Navigating a post-deflationary landscape adds complexity to the situation. Image: BofA Global Investment Strategy