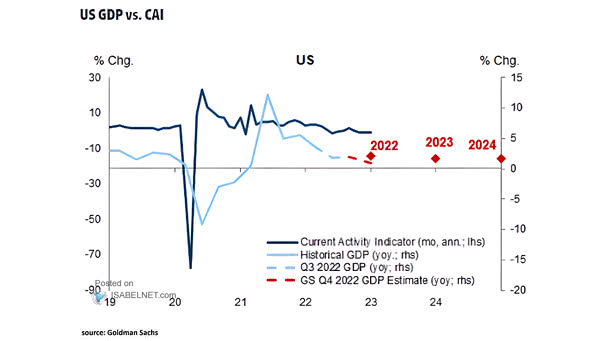
S&P 500 and U.S. IPO Activity
S&P 500 and U.S. IPO Activity IPO activity in the United States is back on the rise, which suggests a bullish medium-term signal. Image: Topdown Charts
China Real GDP Growth vs. Current Activity Indicator (CAI) Goldman Sachs forecasts China real GDP growth of 5.4% in 2023 and 4.5% in 2024. Image: Goldman Sachs Global Investment Research
Global Real GDP Growth vs. Current Activity Indicator (CAI) Goldman Sachs forecasts global real GDP growth of 2.5% in 2023. Image: Goldman Sachs Global Investment Research
U.S. Recession – Number of States with Increasing Activity The odds of a U.S. recession in 2023 appear high. Image: Deutsche Bank
U.S. ISM Manufacturing PMI vs. Philadelphia Fed General Activity vs. U.S. Empire State Manufacturing Survey Regional business activity surveys suggest a lower ISM Manufacturing PMI over the coming months. Image: Morgan Stanley Research
U.S. GDP vs. Current Activity Indicator Goldman Sachs expects U.S. GDP growth of 1.7% in 2023. Image: Goldman Sachs Global Investment Research
Euro Area GDP vs. Current Activity Indicator Will the eurozone face a severe economic slowdown in 2023? Image: Goldman Sachs Global Investment Research
U.S. GS Financial Conditions Index vs. Current Activity Index The tightening in financial conditions does not bode well for activity. Image: Goldman Sachs Global Investment Research
Individual Investors Activity in Options – S&P 500 Options and Top 50 Options Options trading activity among individual investors remains elevated. Does it suggest a future market meltdown? Image: Goldman Sachs Global Investment Research