Risk Appetite Indicator Level and Momentum Factors
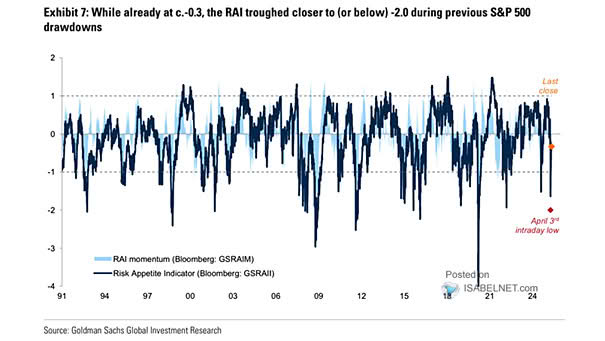
Risk Appetite Indicator Level and Momentum Factors The GS risk appetite indicator’s current risk-on signal suggests a constructive market environment, with investors willing to take on risk in anticipation of sustained positive returns and economic stability. Image: Goldman Sachs Global Investment Research