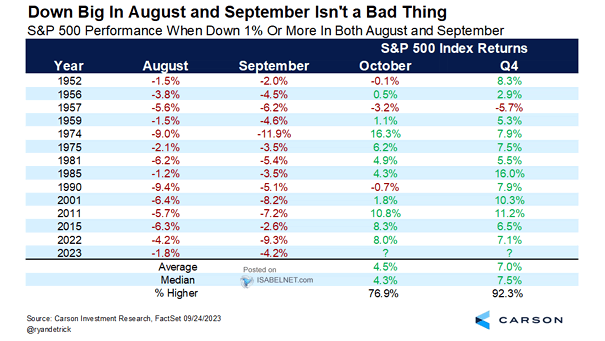
S&P 500 Performance When Down 1% or More in Both August and September

S&P 500 Performance When Down 1% or More in Both August and September Historically, after a decline of 1% or more in both August and September, the S&P 500 tends to rebound in October and perform well in Q4, suggesting that a temporary setback in late summer is often followed by a period of recovery…

ISM YoY and U.S. 2+10-Year Bond Yield YoY (Leading Indicator)

ISM YoY and U.S. 2+10-Year Bond Yield YoY (Leading Indicator) The U.S. 2+10-year bond yield YoY (inverted) tends to lead the ISM YoY by 18 months, suggesting that the growth momentum is expected to fade through H1 2022. Image: Nordea and Macrobond

Trade Globalization

Trade Globalization Will the coronavirus pandemic add momentum to the deglobalization trend? Image: BCA Research

ANZ Global Lead Index

ANZ Global Lead Index The ANZ Global Lead Index is a leading indicator on global industrial production. The chart shows that growth momentum peaked in 2018. Currently, global growth is actually starting to moderate seriously. Image: ANZ Research

Global Growth Economy

Global Growth Economy This chart shows the global real GDP growth and the long-term growth momentum. It’s never paid to bet against America. Picture Source: J.P. Morgan Asset Management

Dow Jones Transportation Average vs. S&P 500

Dow Jones Transportation Average vs. S&P 500 This interesting chart suggests that the Dow Jones Transportation Average underperforms in secular bull markets. Actually, the S&P 500 had higher returns when the Dow Jones Transportation Average experienced negative momentum. Image: Oppenheimer & Co.

U.S. Unemployment Rate at 3.6% in April 2019

U.S. Unemployment Rate at 3.6% in April 2019 This is the lowest level since 1969!  Is this a sign of a booming economy? In any case, the U.S. economy does appear to be gaining momentum and that’s good news. See how the U.S. productivity has increased under Trump. Image: Hedgeye Risk Management LLC