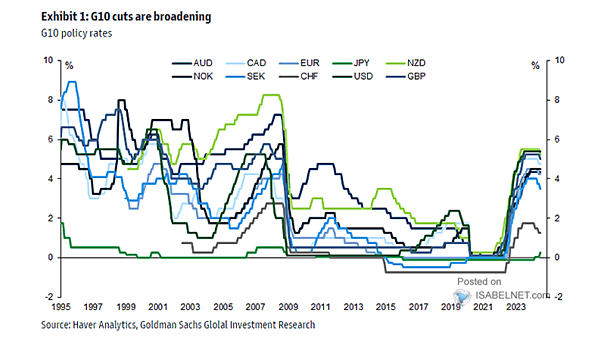
U.S. Dollar Index vs. G10 Breadth
U.S. Dollar Index vs. G10 Breadth Will the U.S. dollar move lower after the recent spike? Image: Topdown Charts
U.S. Dollar Index (DXY) vs. U.S. Minus G10 (Ex. U.S.) 2-Year Yield Rising U.S. interest rates tend to make the U.S. dollar stronger. Image: Alpine Macro
Economic Surprises Index – China vs. G10 Economies Will G10 economies follow China? Image: BCA Research
G10 Policy Rates The level of G10 policy synchronization should continue. Image: Goldman Sachs Global Investment Research
G10 Central Bank Government Bond Holdings Most central banks are expected to maintain the pace of their asset purchases through the rest of 2021. Image: Nordea and Macrobond
G10 Central Bank Expected Average Monthly Quantitative Easing (QE) in 2021 Central banks are expected to provide more liquidity to markets in 2021. Image: Morgan Stanley Research
G10 10-Year Yield Forecasts Before the vaccine news, Goldman Sachs forecasted the U.S. 10-year Treasury yield at 0.75% by the end of 2020 and 1.30% by the end of 2021. Image: Goldman Sachs Global Investment Research
G10/USD Average August Performance Since 2010 Since 2010, G10 risk-on currencies tend to weaken in August. Image: Deutsche Bank
G10 Real GDP Forecast Morgan Stanley expects a much faster recovery than the Great Financial Crisis. Image: Morgan Stanley Research
G10 Central Bank Balance Sheets The total size of G10 central bank balance sheets has now surpassed $20 trillion. Image: Deutsche Bank