U.S. 10Y-2Y Yield Curve and Fed Balance Sheet Total Reserves
U.S. 10Y-2Y Yield Curve and Fed Balance Sheet Total Reserves What is the risk of tapering? After Dec-13 tapering, the U.S. Treasury yield curve flattened considerably. Image: Deutsche Bank
FMS Investors and Yield Curve Expectations 83% of FMS investors expects a steeper yield curve. This is an all-time high. Image: BofA Global Fund Manager Survey
U.S. Dollar vs. U.S. Yield Curve If the U.S. yield curve continues to steepen, it should be negative for the U.S. dollar. Image: Deutsche Bank
U.S. 10Y-2Y Yield Curve vs. U.S. Excess Liquidity (Leading Indicator) U.S. excess liquidity tends to lead the U.S. 10Y-2Y yield curve by 9 months. Image: Variant Perception Research
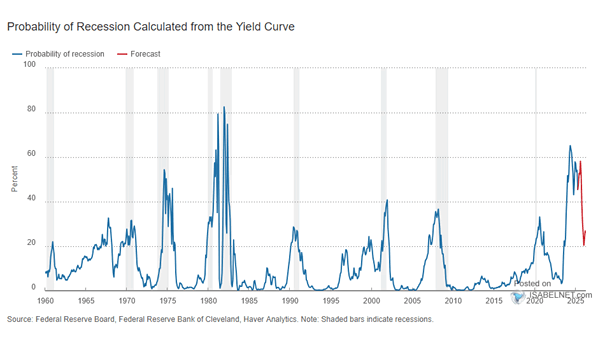
Probability of U.S. Recession Calculated from the Yield Curve The probability of U.S. recession over the next 12 months, calculated from the yield curve, decreased to 14.9% in December. Image: Federal Reserve Bank of Cleveland
Average U.S. Yield Curve Level and U.S. Recessions The U.S. yield curve is likely to steepen further. Image: Scotiabank GBM Portfolio Strategy
U.S. Treasury Yield Curve The U.S. Treasury yield curve is likely to steepen further in 2021, as expectations for tapering increase. Image: J.P. Morgan Asset Management
FMS Investors and 10Y-3M Yield Curve FMS investors are expecting a steeper yield curve. At 73%, this is an all-time high. Image: BofA Global Fund Manager Survey
Small Cap Stocks – Russell 2000 vs. S&P 500 and 10Y-2Y Treasury Yield Curve Will small-caps outperform large-caps? Image: Alpine Macro
U.S. Treasury 5s30s Yield Curve and Odds of Democratic Senate Majority Chart suggesting that the U.S. Treasury yield curve is steepening with odds of a Democratic Senate majority. Image: BofA Research Investment Committee