ISM Manufacturing Index and Recessions
ISM Manufacturing Index and Recessions Economic growth tends to peak about a year after the recession ends. Image: Deutsche Bank Asset Allocation
ISM Manufacturing Index vs. S&P 500 Ratio to 12-Month Moving Average Historically, the S&P 500 tends to pull back as economic growth peaks. Image: Deutsche Bank Asset Allocation
ISM Manufacturing Index and ISM Prices Paid Index (Leading Indicator) The ISM Prices Paid Index tends to lead the ISM Manufacturing Index by 12 months, suggesting a mid-cycle shift this year. Image: Morgan Stanley Research
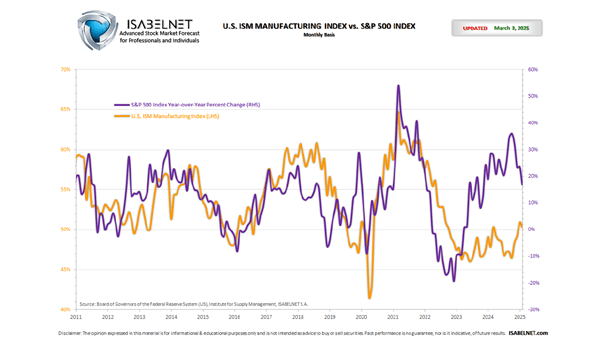
ISM Manufacturing Index vs. S&P 500 Index This chart shows the correlation between the ISM manufacturing index and the S&P 500 index year-over-year percent change, since 2011. U.S. ISM Manufacturing Index rose to 64.7% in March. Click the Image to Enlarge
Average Forward S&P 500 Return Conditional on ISM Manufacturing Index at Time of Investment When the ISM is above 60, like today, the return on the S&P 500 tends to be negative over the next 3 and 6 months. Image: Goldman Sachs Global Investment Research
U.S. ISM Manufacturing Index vs. U.S. Core CPI (Core Inflation Leading Indicator) U.S. annual core CPI at 1.3% in February. The U.S. ISM Manufacturing Index tends to lead U.S. Core CPI by 24 months. You may also like “ISM Manufacturing Index vs. S&P 500 Index” and “U.S. Core Inflation Expected Over the Next 21 Months.“…
ISM Manufacturing Index and SOX Philadelphia Semiconductor Index Chart showing the good correlation between the ISM Manufacturing Index and the performance of the SOX Philadelphia Semiconductor Index. Image: BofA Global Investment Strategy
ISM Manufacturing Index vs. S&P 500 Cash Flow Chart showing the correlation between S&P 500 cash flow and the ISM Manufacturing Index. Image: Raoul Pal
Philly Fed Manufacturing Index and Empire State Manufacturing Survey and ISM Manufacturing Index Despite the coronavirus, both regional PMIs suggest an increase in U.S. ISM manufacturing this month. Image: Swedbank Research
ISM Manufacturing Index vs. ISM Non-Manufacturing Index The ISM Non-Manufacturing Index increased to 55.5% in January and suggests faster expansion in January than in December. Image: Oxford Economics