Gold to Silver Ratio
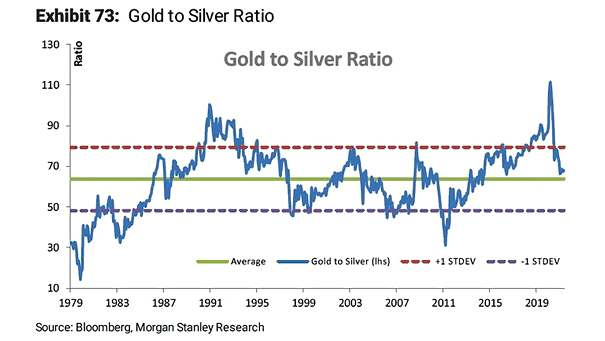
Gold to Silver Ratio The gold to silver ratio is an interesting indicator at its extremes. Image: Morgan Stanley Research
Gold to Silver Ratio The gold to silver ratio is an interesting indicator at its extremes. Image: Morgan Stanley Research
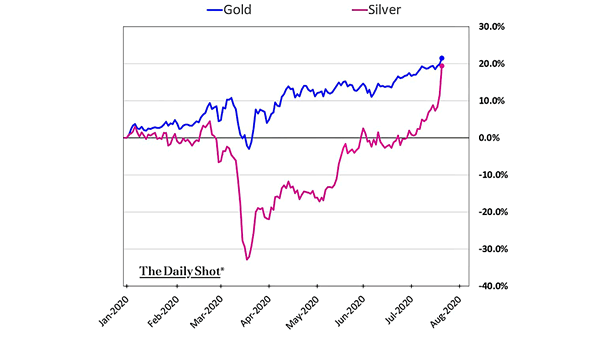
Gold vs. Silver Gold approaches record as silver prices surge to highest levels in years, amid growing coronavirus fears. Image: The Daily Shot

Gold and Silver Forecasts Bank of America forecasts gold price $1700 by year-end. Image: BofA Global Research
Oil, Gold, Silver, and Wheat vs. Commodities Chart showing that individual commodities have historically moved together over a long period of time. Image: Wells Fargo Investment Institute
Gold and Silver Weekly Fund Flows This is the biggest outflows from gold since December 2016, as a more positive global outlook drives optimism. Image: BofA Merrill Lynch Global Investment Strategy
Utilities-to-Gold & Silver Mining Stocks Ratio Since 1990 S&P 500 Utility Sector to Philadelphia Gold and Silver Index hits all-time high. Image: Crescat Capital LLC